
Data Management
This document demonstrates how to manage data before you start build machine learning models. After a Project has been created, you will be taken to the Data page, where you can upload or collect data.
We recommend that you first collect data with the Qeexo AutoML web app to ensure that everything is working properly before trying to upload your own data.
In this article:
2-2 Upload data and confirm sensor configurations
4. Training data and Test data
4-3 Training and test data operations
4-3-6-2 Show / hide sensors & Axes
4-3-6-3 Modifying / Deleting Segments
4-3-6-4 Segmentation version history
5. Viewing and managing project data
Prerequisites
Sensor is already connected with your laptop through USB or bluetooth
1. Collecting data
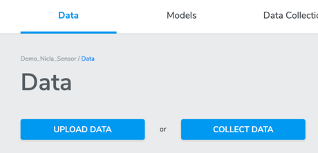
Navigate to the Data Collection page to collect data using the Qeexo AutoML web app. This can be done either by clicking the COLLECT DATA button or the Data Collection tab. Then you will be navigated to Data Collection page.
Note -If custom sensors are being used and there is existing data, the Data Collection Process is not required. This is only applicable when using AutoML supported hardware.
For projects utilizing AutoML supported hardware, the Data Collection Process ensures that all necessary data is accurately gathered and processed. However, when custom sensors and pre-existing data are involved, this step can be bypassed, streamlining the workflow.
1-1 Step 1: Build Environment
*What is Environment?
An Environment is a physical setting with a given set of properties (e.g. acoustics, temperature, lighting). The range of this set of properties should match the range of the environment where the final machine learning model will eventually run. For example, training the machine learning models with data in your office will likely not work very well once you test the trained models on the factory floor. Environments also contain information about the given sensor configuration settings. All data collected for a given Environment will have the same sensor configuration.
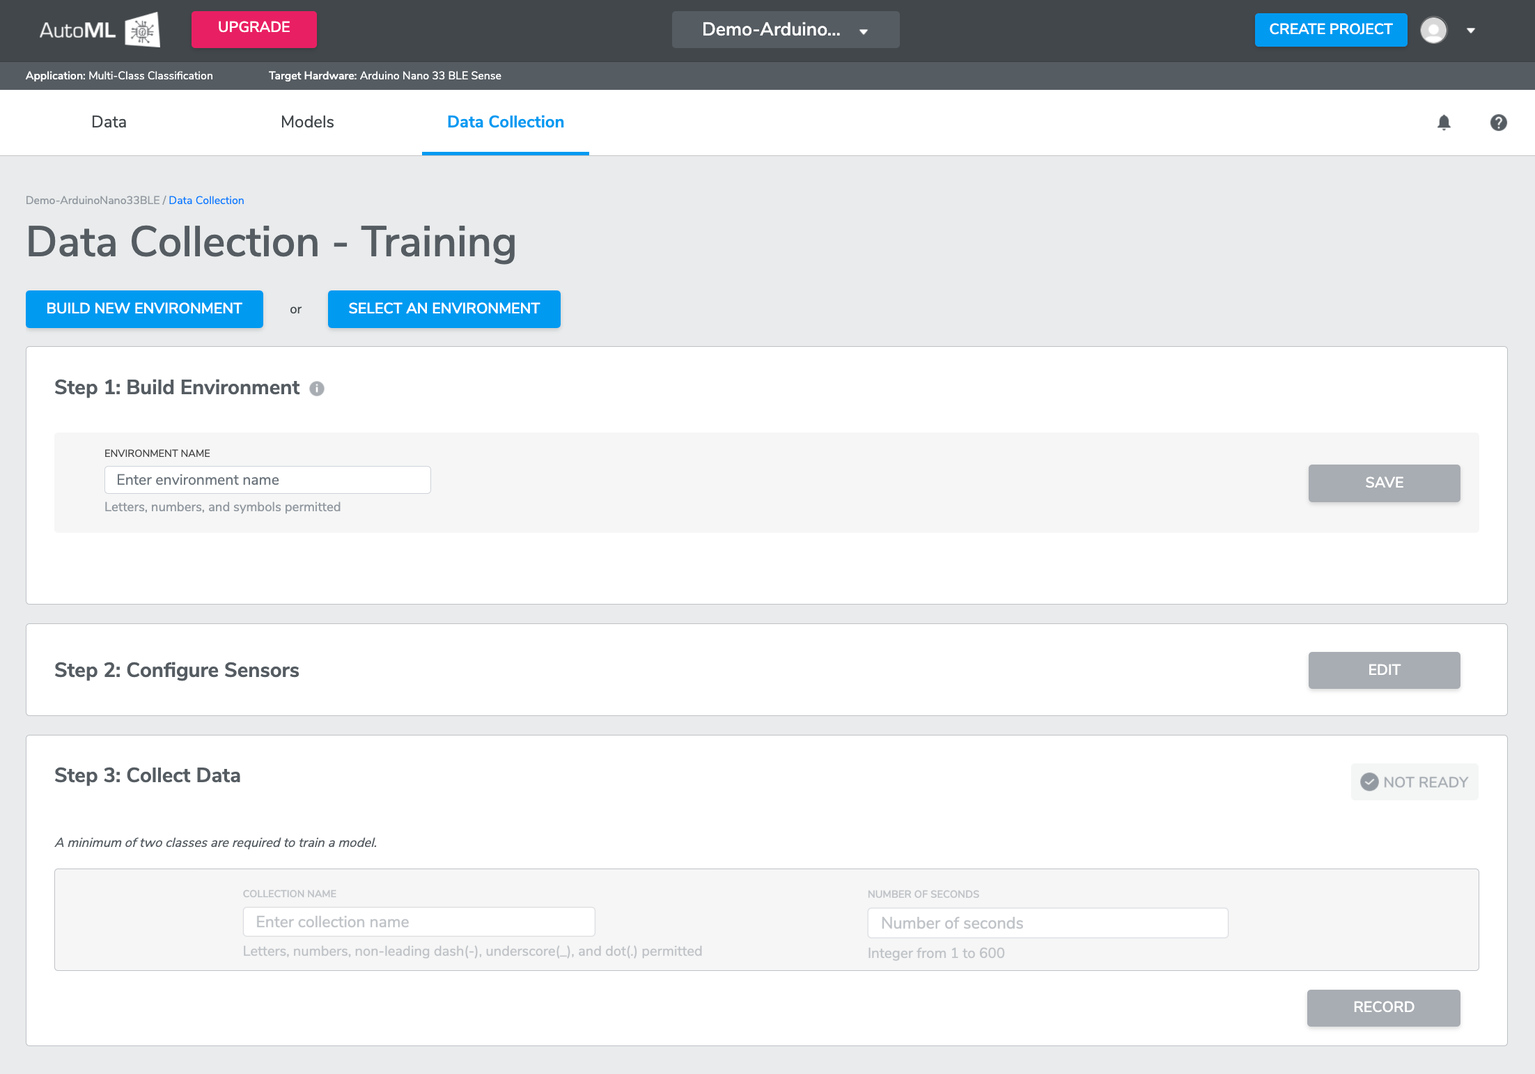
You can either BUILD NEW ENVIRONMENT by entering a unique "Environment Name", or SELECT ENVIRONMENT to add more data to a previously recorded Environment. If selecting an existing Environment, the Sensor Configuration (in Step 2: Configure Sensors) will automatically populate with the Environment's previous settings. You should name your Environment something easily recognizable to you, with details about the specific location. For example, "OfficeCoffeetable" or "VestasTurbineSolano".
IN DEMO CASE we name the environment as “Office-environment” as the model training is done in an office environment. Once you input the name, click SAVE to proceed to next step.
1-2 Step 2: Configure Sensors
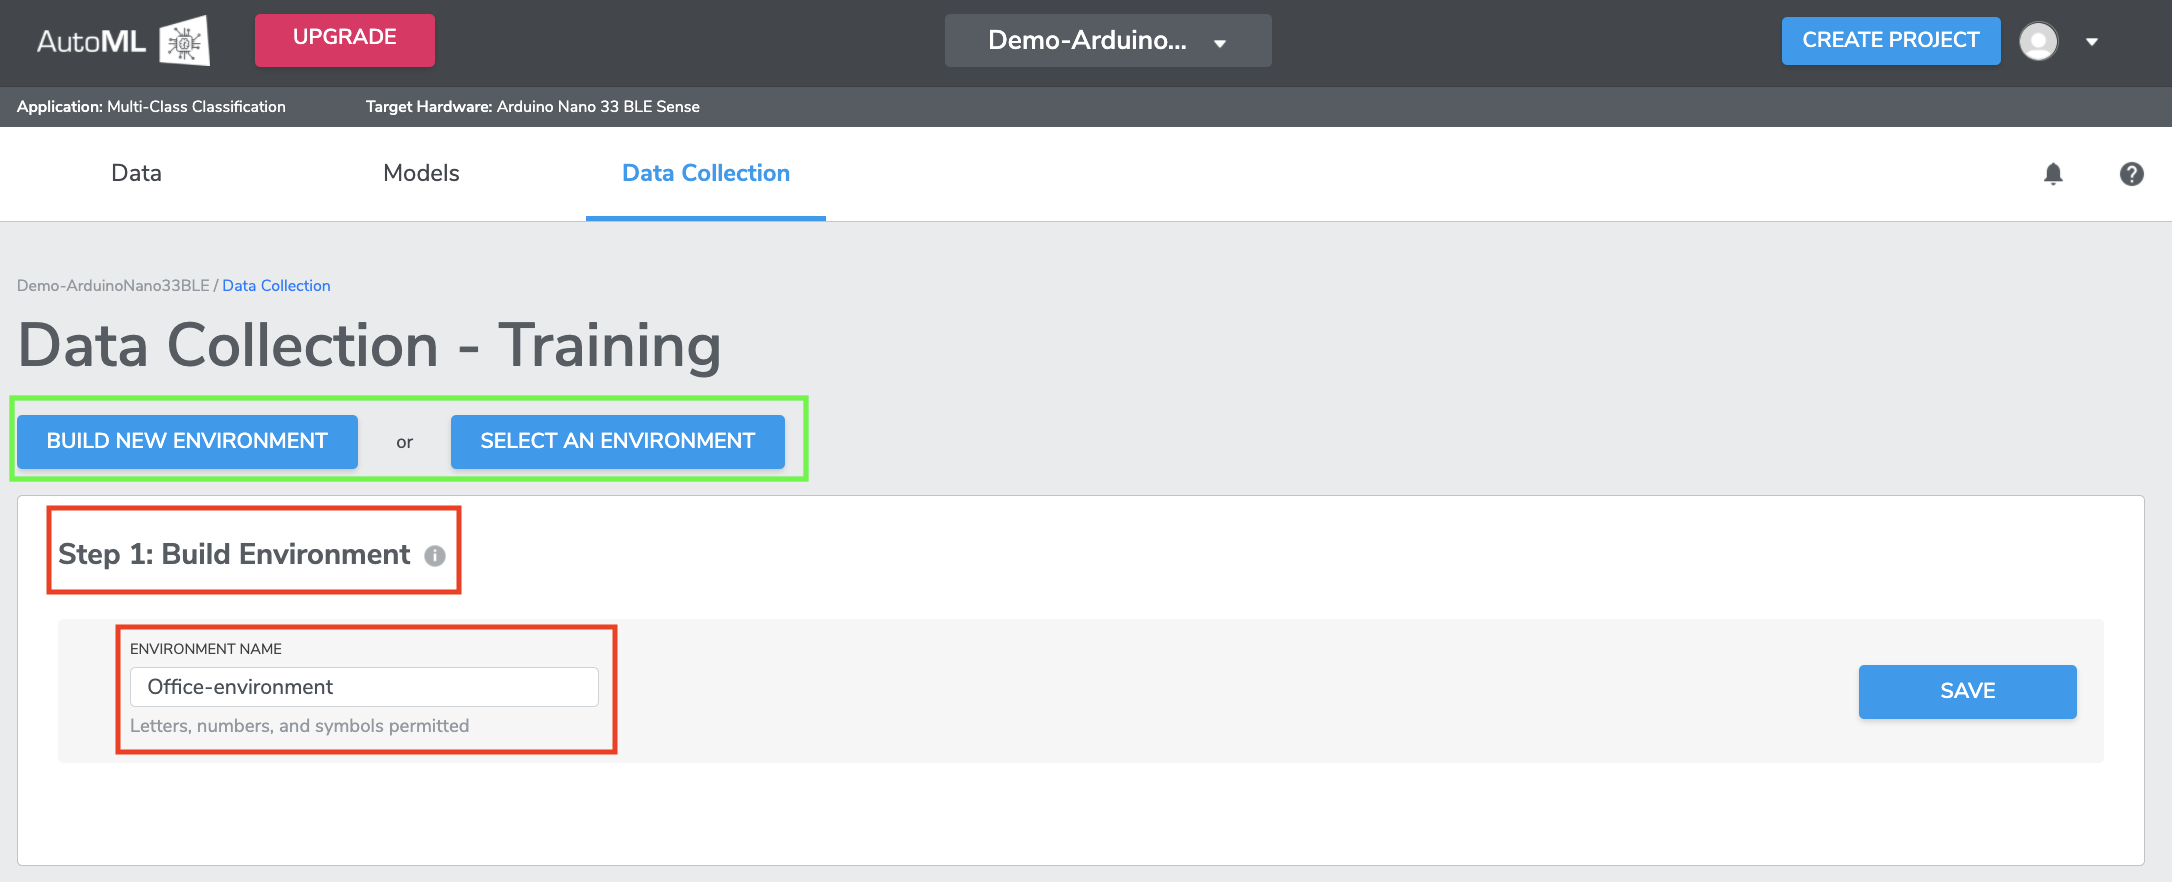
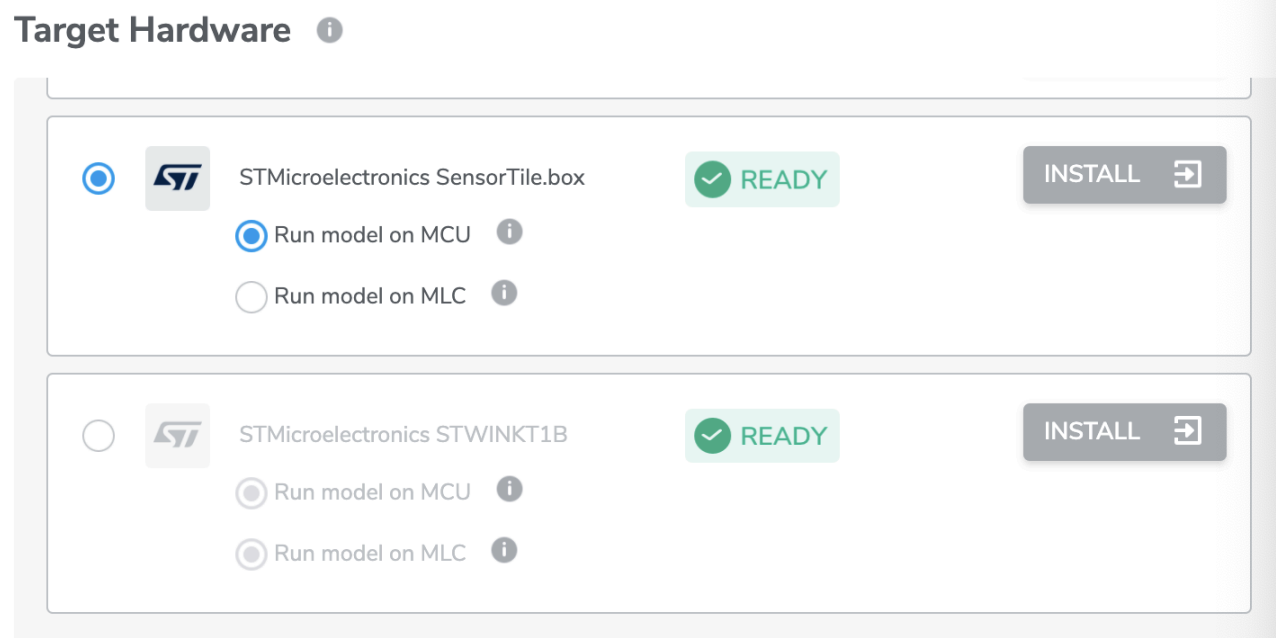
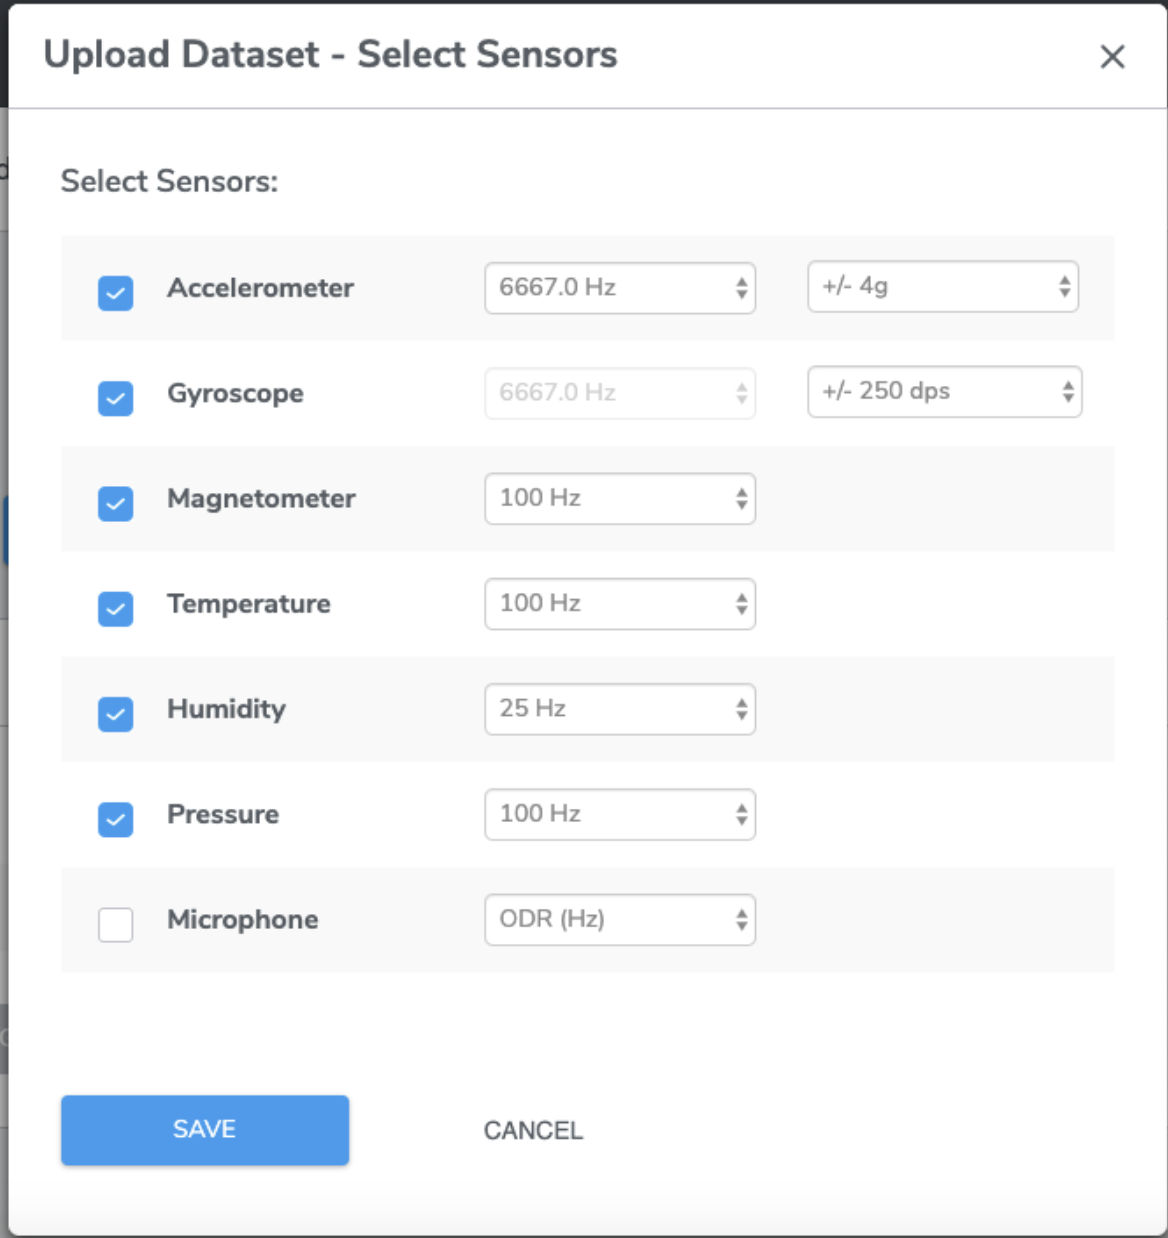
Click EDIT in Step 2: Configure Sensors to view a list of the supported sensors on the Target Hardware. You may select any combination of the sensors listed on this menu (shown as below) to collect your data. After selecting the sensors, you will need to configure the corresponding sampling rate - ODR (Output Data Rate) for each sensor, and the Full Scale Range (FSR) when available.
*For ST sensors, if you are selecting MLC project type, note that only accelerometer and gyroscope are available.
For Custom Sensors using Cortex A and Cortex M hardware: Five additional custom sensor configuration parameters have been provided to capture other parameters beyond the general ones recorded for other hardware. This offers flexibility to train the model when not using internal AutoML supported hardware. The parameter names are:
custom_sensor_1,custom_sensor_2,custom_sensor_3,custom_sensor_4,custom_sensor_5.These additional parameters are provided to ensure comprehensive data capture, allowing for more precise and tailored model training. By accommodating custom sensors, the system can be adapted to a wider range of applications and use cases, enhancing its versatility and effectiveness. The inclusion of these parameters allows the capture of specific data points that are critical for unique sensor configurations, thereby improving the accuracy and performance of the trained models. For example - .CSV sample reference to train the model- 5customsensors_BACKGROUND_v0.csv
*The optimal ODR and FSR configuration depends on the use case. For example, using an ODR of over 1000 Hz will generally give some useful detail when detecting and analyzing turbine vibrations, while ODR of ~100 Hz or less may be more suitable for human activity detection. Having a larger FSR will allow you to see larger variations in sensor values, but the resolution will be compromised, so you will get less detail.
*Finding the optimal settings may take some trial-and-error. Qeexo AutoML's data visualization support (see section on Visualizing Data) may help in finding these settings. For example, if the peaks of your signal appear to be cut off, or saturating, you may want to increase the FSR of your sensor.
Currently, accelerometer and gyroscope MUST share the same ODR.
IN DEMO CASE we set the ODR and FSR as below:
After selecting the desired sensors and settings, click FLASH DATA COLLECTION APP (shown as picture above) to flash the data collection application to the Target Hardware.
*Note: Before you click on FLASH DATA COLLECTION APP, please make sure your sensor module is connected with your laptop with either USB or bluetooth.
If this is your first data collection for a given sensor configuration, Qeexo AutoML needs to build the data collection application first. This can take a few minutes, but it will only have to be done once for each new configuration.
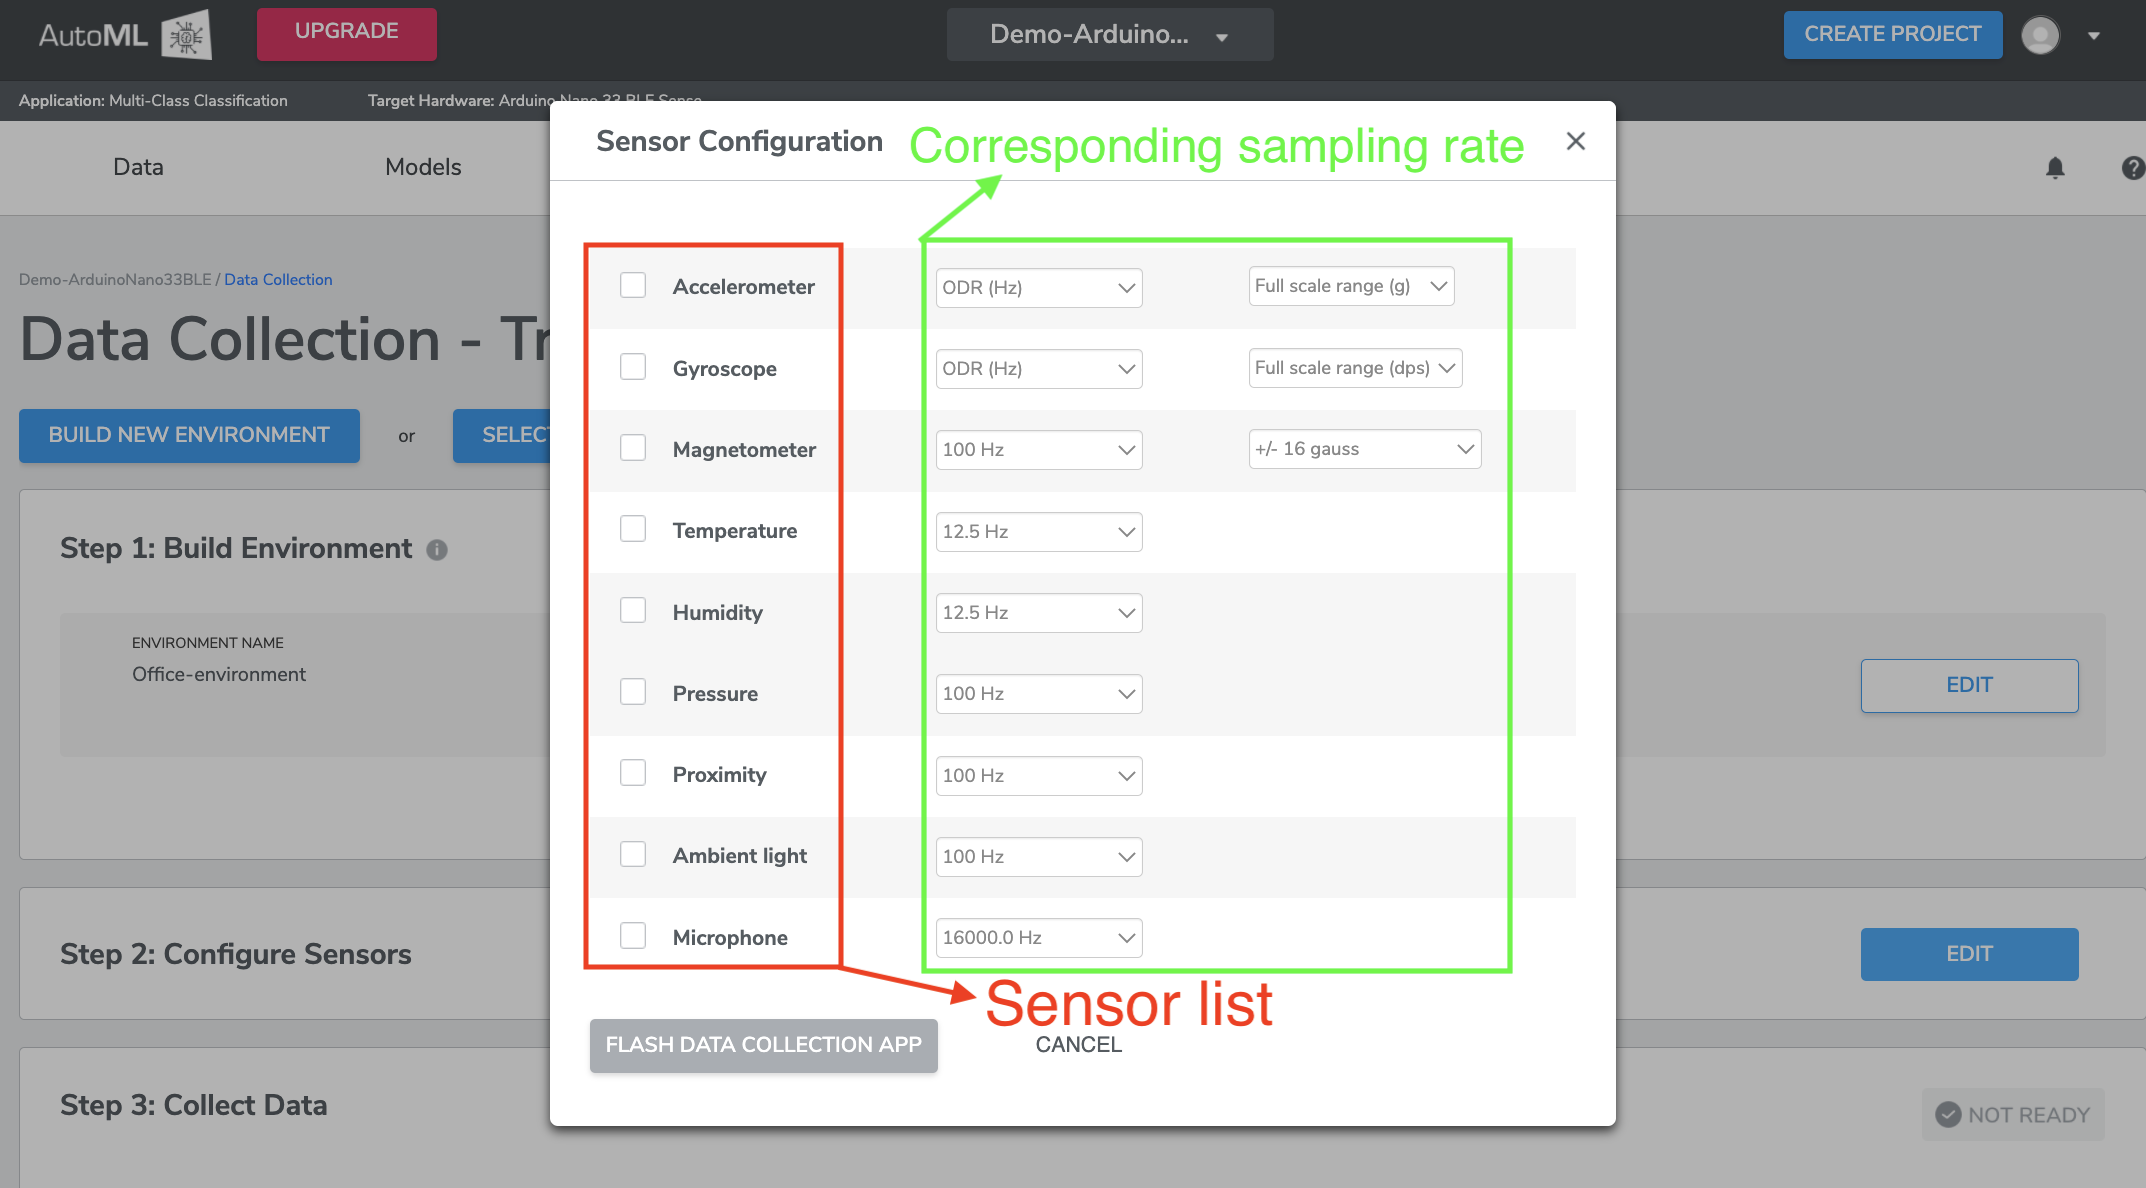
1-3 Step 3: Collect Data
Qeexo AutoML currently supports a variety of supervised classification algorithms for machine learning. For each of these algorithms, all data used for training must have an associated Class Label(aka, COLLECTION NAME).
*For multi-class and multi-class anomaly projects, at least two unique classes must be defined. For most problems, we recommend that at least one of the classes be a "baseline" class that represents the typical environmental noise or behavior.
Whether or not baseline data is necessary depends on the use case and data selected. In general, the classes collected for multi-class classification should represent the full set of possible states for the given Environment. For example, if you want to build a multi-class model which can distinguish between various types of machine vibrations (e.g. slow, medium, fast), you should collect data which represents all possible different types of machine vibrations. In this case, if the model output will also be used in the "baseline" case where the machine is off, this data should be collected as well.
- Baseline Data:
Baseline data can be collected by leaving data collection application to run while the environment is in a steady state of rest or typical operating behavior.
Some machine learning problems require collecting baseline data to differentiate events of interest from normal environmental conditions.
Baseline data is usually associated with each Environment since different Environments will often have different baseline data characteristics.
For example, baseline data might be "NoGesture" in gesture recognition, "None" in kitchen appliance detection, or "AtRest" in logistics monitoring.
- Class Label / Collection Name
A Class Label is a machine learning concept, normally a word or phrase to label the event or condition of interest. For example, "Normal", "WornBearings", and "WindingFailure" can be classes in our Turbine Predictive Maintenance problem.
You must define one Class Label at a time when collecting data by entering a text string in the given field.
You can re-define class label by creating segmentation within a data collection.
Note that only alphabets, numbers, and underscores are allowed when naming class labels in MLC projects.
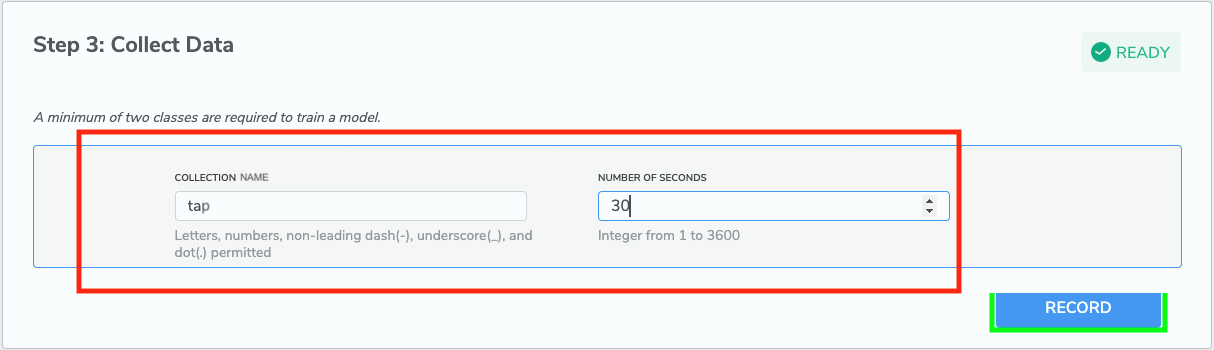
- Number of Seconds
This sets the duration of the data collection.
More data generally leads to higher performance. Depending on the complexity of the use case, the number of classes, the quality of the data, and many other factors, the optimal and minimum number of seconds to collect can vary greatly.
We recommend starting with at least 30 seconds for each Class Label. For event-based data, a minimum of 30 events for each class is recommended, but much more data may be required if the classes are highly variable or if the problem is sufficiently complex.
We recommend starting with at least 30 seconds for each Class Label, but much more data may be required if the classes are highly variable or if the problem is sufficiently complex.
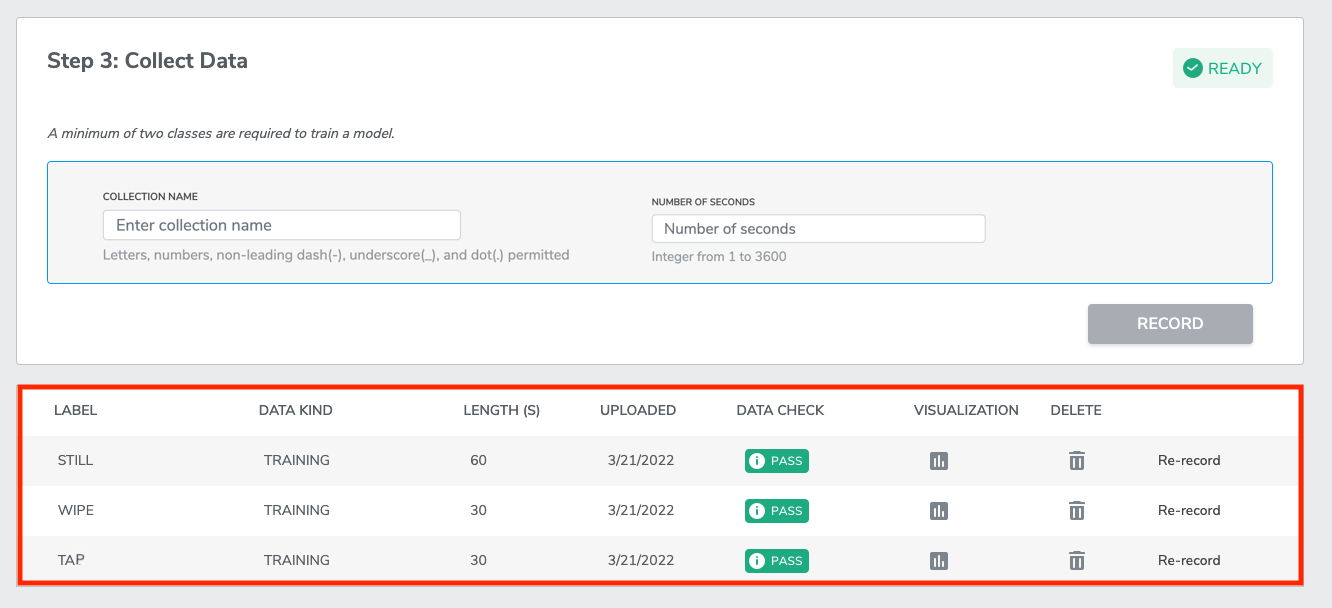
IN DEMO CASE we are going to create 3 class labels which are “tap”, “wipe” and “still”. “still” is our baseline class meaning data collected when the sensor is staying still. Moving to next section to see how to record data for each of the class label.
*Note you need to repeat step 3 for each label’s data recording.
1-3-1 Recording data
After completing the previous steps, the RECORD button should now become click-able (shown as green part in the picture above). If it is not, check previous steps.
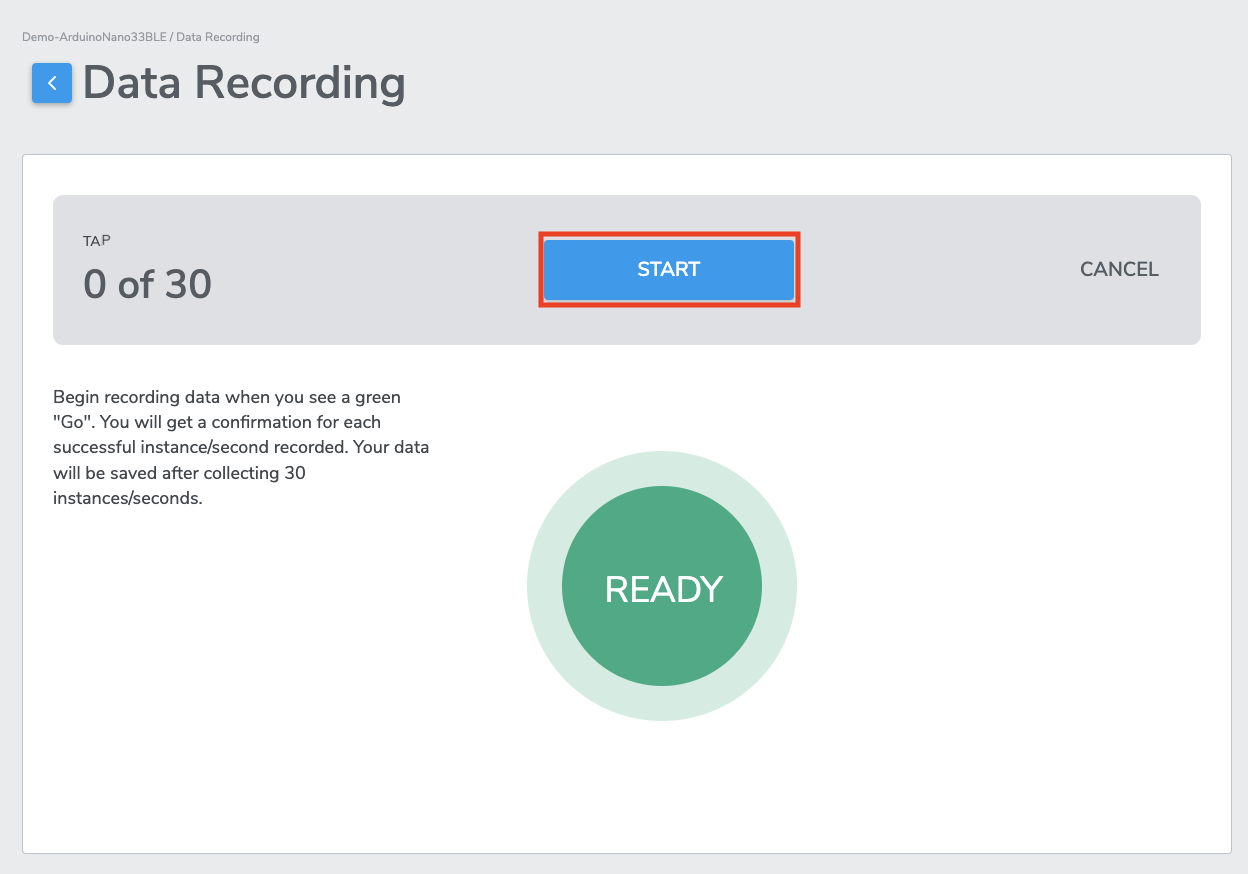
After clicking RECORD, you will be directed to the Data Recording page. When you are ready to start data collection, click START to begin. The text in the center cycle will change from “READY” to “INITIALIZE” while the data collection software is starting up.
After a few seconds, data collection will start when you see the circle turn green and display "GO". Data is now being collected. As you tap the physical sensor every time, the center cycle will have a “✓“ sign.
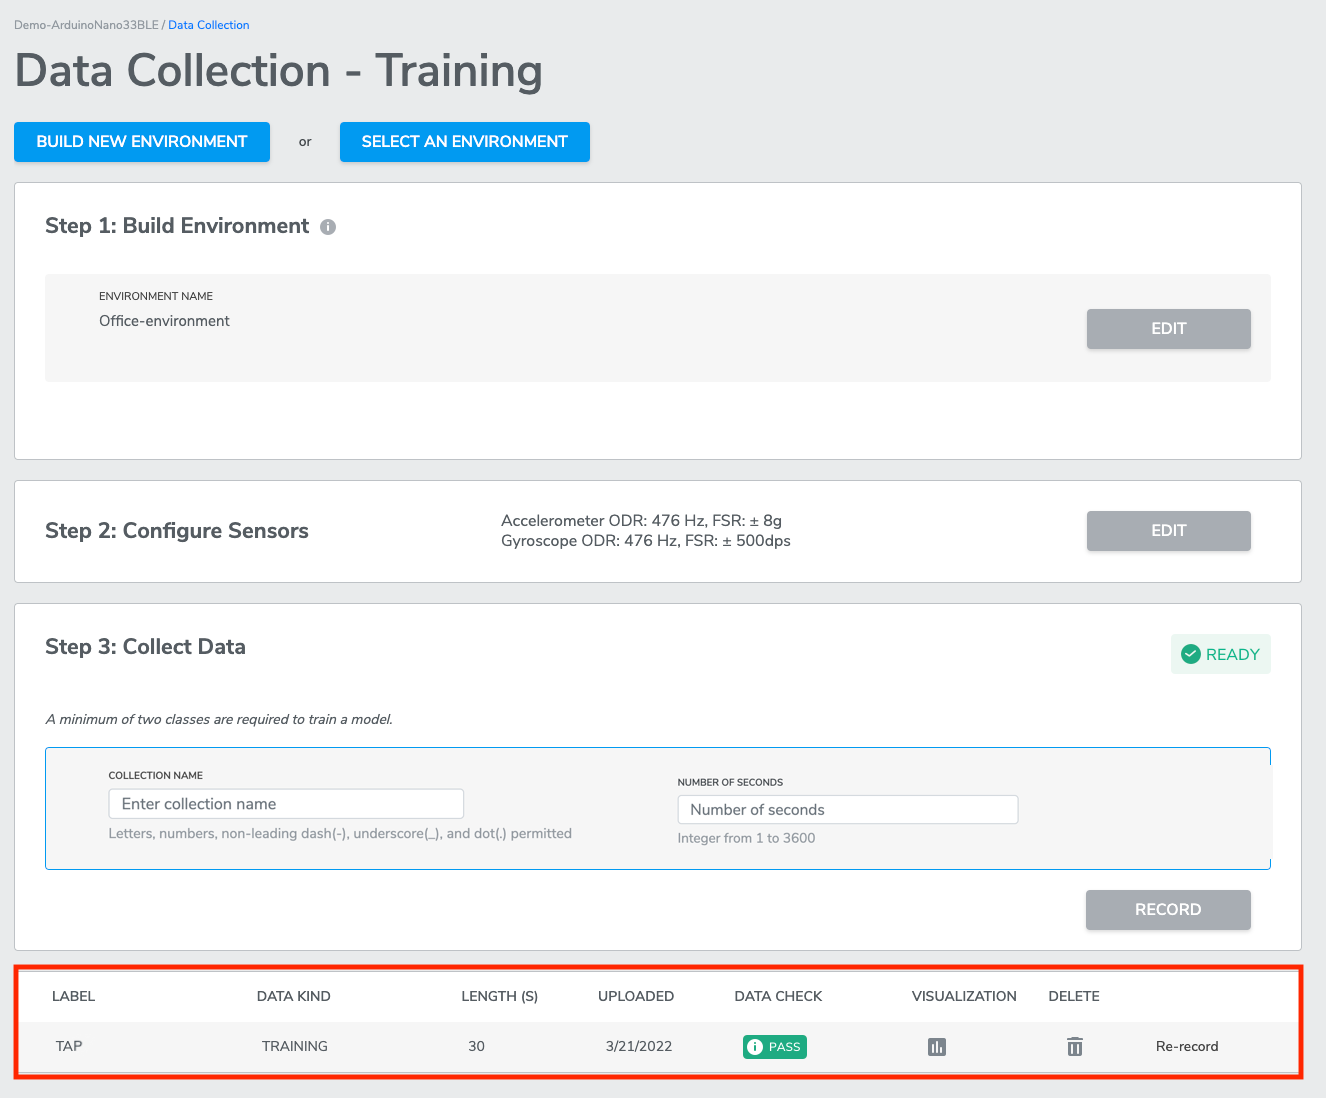
Once the specific “number of seconds” have been collected, the labeled data will be uploaded to the database, and user will redirected to the Data Collection page.
You can collect more data of the same of different Class Label from the Data Collection page.
*Note that for a multi-class classification project, you will need at least 2 distinct classes (aka, 2 different Class Labels) to be able to train machine learning model.
IN DEMO CASE we will be creating 3 Class Labels in total, which are “tap”, “wipe”, and “still”. You need to go through the process of Collect Data and Recoding data for two more times for the two left classes (“wipe” and “still”).
*Note when you record data for “wipe”, you should wipe you sensor to collect data; when you record data for “still”, you should let you sensor stay still to collect data. The final result should looks like below.
1-3-2 Re-recording data
If you believe a mistake has been made when recording data, and the data has been contaminated, you can re-record the data from the bottom of the Data Collection page. You can click Re-Record to overwrite the existing data. Alternatively, you can click on the Trash icon to delete the Data Collection and start over.

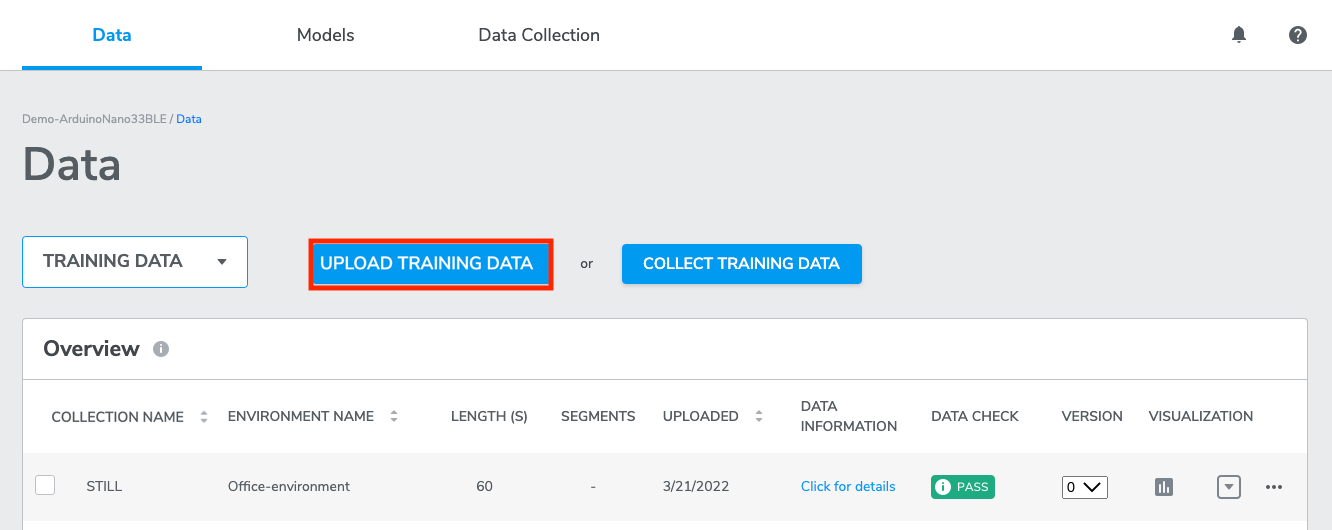
2. Uploading dataset
Other than collecting training data, you could also choose option of upload training data. From the Data page, you may upload previously-collected datasets to AutoML directly. These uploaded datasets can be used to train machine learning models, and can be combined with additional data that has been collected through the Qeexo AutoML platform.
Refer to the file sample datasets if you would like some example data for upload. The sample dataset includes files as shown below.
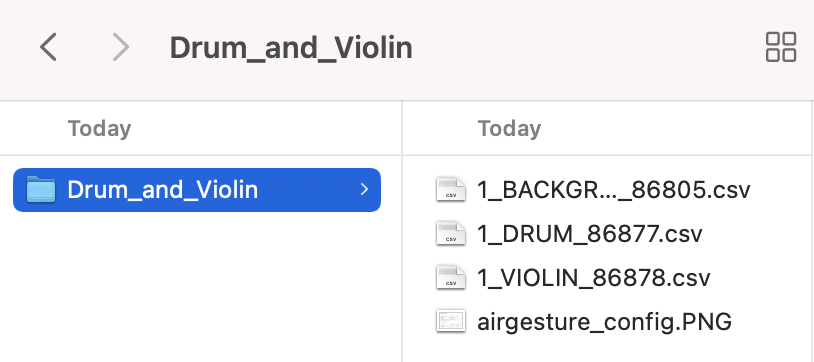
The demo case in this article will not upload dataset since we have previously collected training data. If you are following along the demo case, you may skip “Uploading dataset” section.
AutoML's upload data functionality will produce the best results if each file contains data from only a single collection period on one device. If there were gaps in the collection period, or if the data was taken from multiple devices, it is recommended to split the separate collections into multiple files for upload.
*Note: Data with the same Class Label must be the same data type.
Click UPLOAD TRAINING DATA to upload up to 10 .csv files. Each .csv file should contain one or more data collections following the Qeexo-defined data format below. All data contained in the .csv file MUST come from the same sensor configuration, which you will enter after uploading the .csv file. If you have more than 70 MB of data, you will need to split it into multiple .csv files.

2-1 Data format specification
Qeexo AutoML can accept two different CSV formats:
V1 CSV format - which is easier to understand and prepare.
V2 CSV format - which can handle multiple data points in a single line; no upsampling is required thus minimizing the chance of data duplication.
We also provide CSV Conversion script (.py) if user has the need to convert rawdata to csv file.
Note that V1 and V2 are for human readability - there is no need to indicate which format as Qeexo AutoML can detect the formatting automatically.
Qeexo AutoML will match the closest ODR of the selected hardware against that of the uploaded data.
Depending on device and sensors used, there are required data types and associated ranges for each of the combinations for Qeexo AutoML to function properly. Please click the expand below to find detailed requirements.
(1) V1 CSV format
The data file consists of 3 parts, in the following order: timestamp, "sensor data", and label.
① timestamp (exactly 1 column):
- Type: float (milliseconds)
- We up-sample lower-sampling-rate sensor data to match maximum sampling rate. Timestamps should indicate the maximum sampling rate.
- Incorrect timestamps may cause data check failure (see Data Check section below).
② sensor data (1 or more columns from list):
- Type: integer
- sensor data column names must match the exact strings that Qeexo uses. For example, accel_x instead of accelerometer_x (see expand list below).
- Column names not matching pre-defined strings may cause data upload to fail.
- Refer to the following table for sensors are supported in the hardware you chose:
③ label (exactly 1 column):
- Type: string
- Label column contains the verified Class Label (decision) for each row of sensor data.
- We recommend that each row in .csv file is sorted with timestamp and grouped by class label.
④ data_type:
- Type: string ("CONTI" or "EVENT")
- "CONTI" for continuous data, "EVENT" for event data
- **Ignore this column while importing data **
⑤ recording_id:
- Type: int (empty or 1,2,3,...)
- Empty if data is continuous data or not belong to any recording
- **Ignore this column while importing data **
⑥ event_id:
- Type: int (empty or 1,2,3,...)
- Empty if data is continuous data or not belong to any event
- **Ignore this column while importing data **
(2) V2 CSV format
The format for uploaded data consists of 3 parts, in the following order: a timestamp column, sensor data column(s), and a label column.
① timestamp (exactly 1 column):
- Type: integer (milliseconds)
- Timestamp column contains the time associated with the sample(s) in a given row.
- Note that each line increases by 50 ms. If the data is sampled at 100Hz, then the number of samples in each line should be 50/(1000/100) or 5 samples.
- Timestamp column should be in ascending sorted order.
- In the case of a row containing multiple samples, the timestamp should be the time associated with the most recent sample in the row (i.e. the time at the end of the given sampling period).
- Incorrect timestamps may cause a data check warning (see Data Check section below).
② Sensor data (1 or more columns):
- Type: list of integers (or list of lists of integers)
- Each sensor data column must represent all channels of a supported sensor type on one of the AutoML-supported hardware platforms. See expand list below for a list of currently-supported column names.
- Each cell in the sensor data column contains all of the sensor's samples associated with the given row timestamp. A cell can contain no samples (e.g. ",[],"), a single sample (e.g. ",[100],"), or multiple samples bracketed in a list (e.g. ",[100,99,101],").
- For sensors with multiple channels, the format is a list of lists of integers, grouped by time. The expected channel ordering for each inner list is x, y, z (for accel, gyro, magno) and c, r, g, b (for ambient light sensor).
- Incorrect column names will cause data upload to fail.
- Incorrect sensor configurations will cause a data check warning (see Data Check section below)
③ label (exactly 1 column):
- Type: string
- Label column contains the class label for each row of sensor data.
④ data_type:
- Type: string ("CONTI" or "EVENT")
- "CONTI" for continuous data, "EVENT" for event data
- **Ignore this column while importing data **
⑤ recording_id:
- Type: int (empty or 1,2,3,...)
- Empty if data is continuous data or not belong to any recording
- **Ignore this column while importing data **
⑥ event_id:
- Type: int (empty or 1,2,3,...)
- Empty if data is continuous data or not belong to any event
- **Ignore this column while importing data **
As shown in the image above, all sensor samples are formatted as lists of integers or lists of lists of integers. For the lowest ODR sensor (humidity), there were only 1-2 samples per sampling period (50 ms for this collection), while the highest ODR sensor (microphone) has hundreds of samples per row. For the multi-channel sensors, the x, y, z and c, r, g, b channels are grouped together in-time and recorded inside their own lists.
2-2 Upload data and confirm sensor configurations
Qeexo AutoML will detect the most appropriate sensor configurations for your uploaded .csv file. You will have the opportunity to accept or select a different values of sensor type, ODR, and FSR. We recommend accepting the auto-detected values. Incorrect sensor configurations may break the library-building process or generate sub-optimal results.
*Note: If your data is collected at an ODR that is too far off from the supported ODR of the selected hardware, you may need to consider up-sampling or down-sampling the data before uploading them to Qeexo AutoML.
3. Data check
Data check verifies the quality of the data, whether uploaded or collected. A failure in data check will NOT prevent you from using the data to train machine learning models. However, poor data quality may result in poor model performance.
Qeexo AutoML currently looks for the following data issues:
collected data does not match the selected sensors in the Sensor Configuration step
collected data does not match the selected sampling rate in the Sensor Configuration step
collected data contain duplicate or missing timestamps
collected data has duplicate values or constant values
collected data contains invalid values including NaN or inf
collected data is saturated
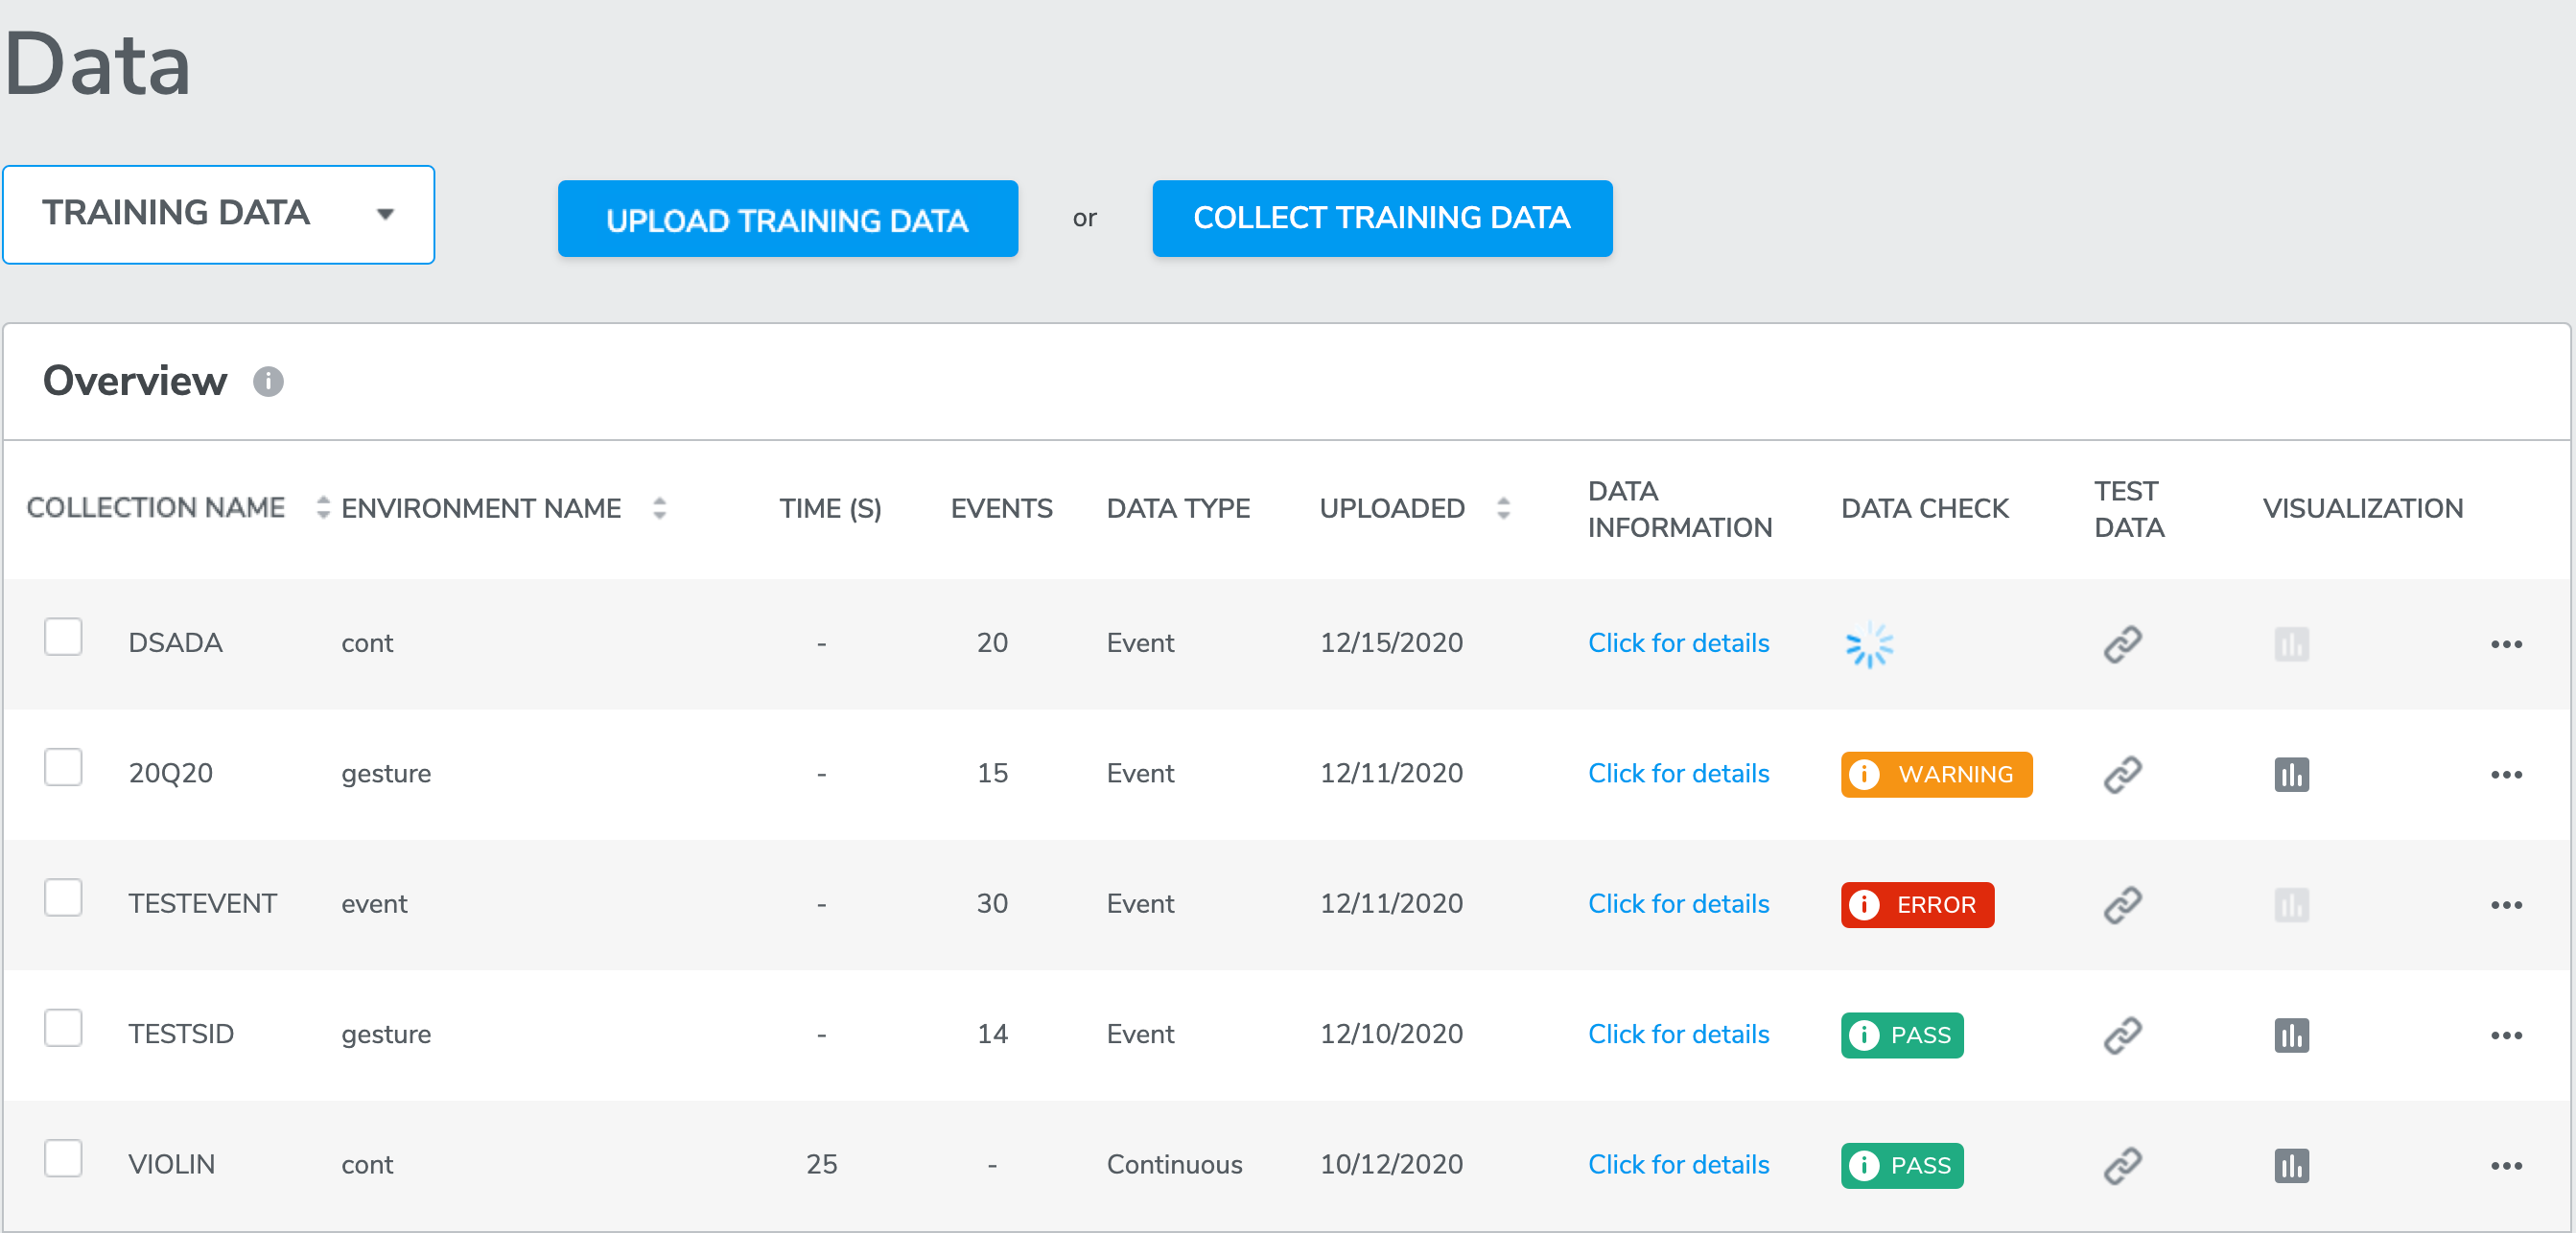
Here is an example of a data check with ‘warning’:
A green PASS icon indicates that data check has passed;
A yellow WARNING icon indicates that the data contains one or more issues from the list above;
A red ERROR icon indicates that something went wrong during data collection or during data check (connection error or device error), the data may not be usable if it remains ERROR after refresh.
4. Training data and Test data
4-1 Training data
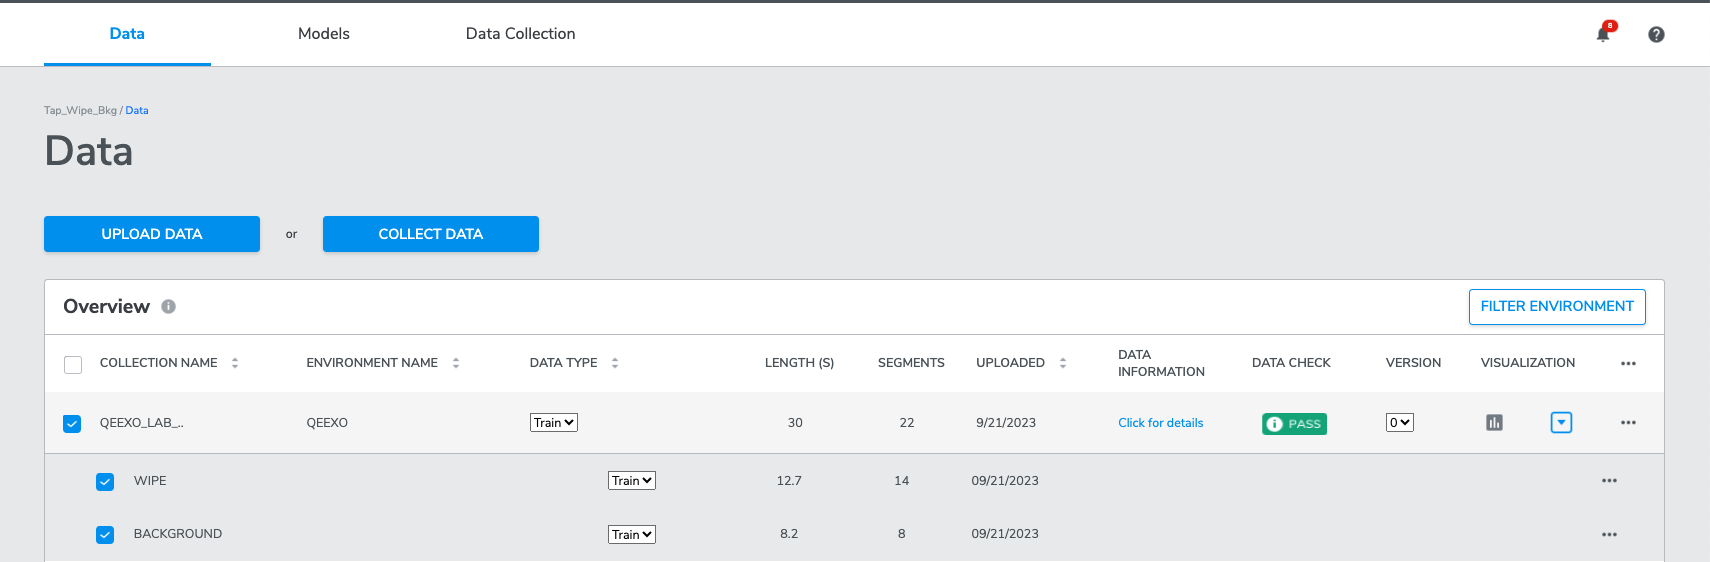
Training data is a set of data instances you plan to train and build models with. By default all data collected or uploaded to the platform is designated as training data. Data type designations can be changed using the DATA TYPE drop-down for any collection or class label.
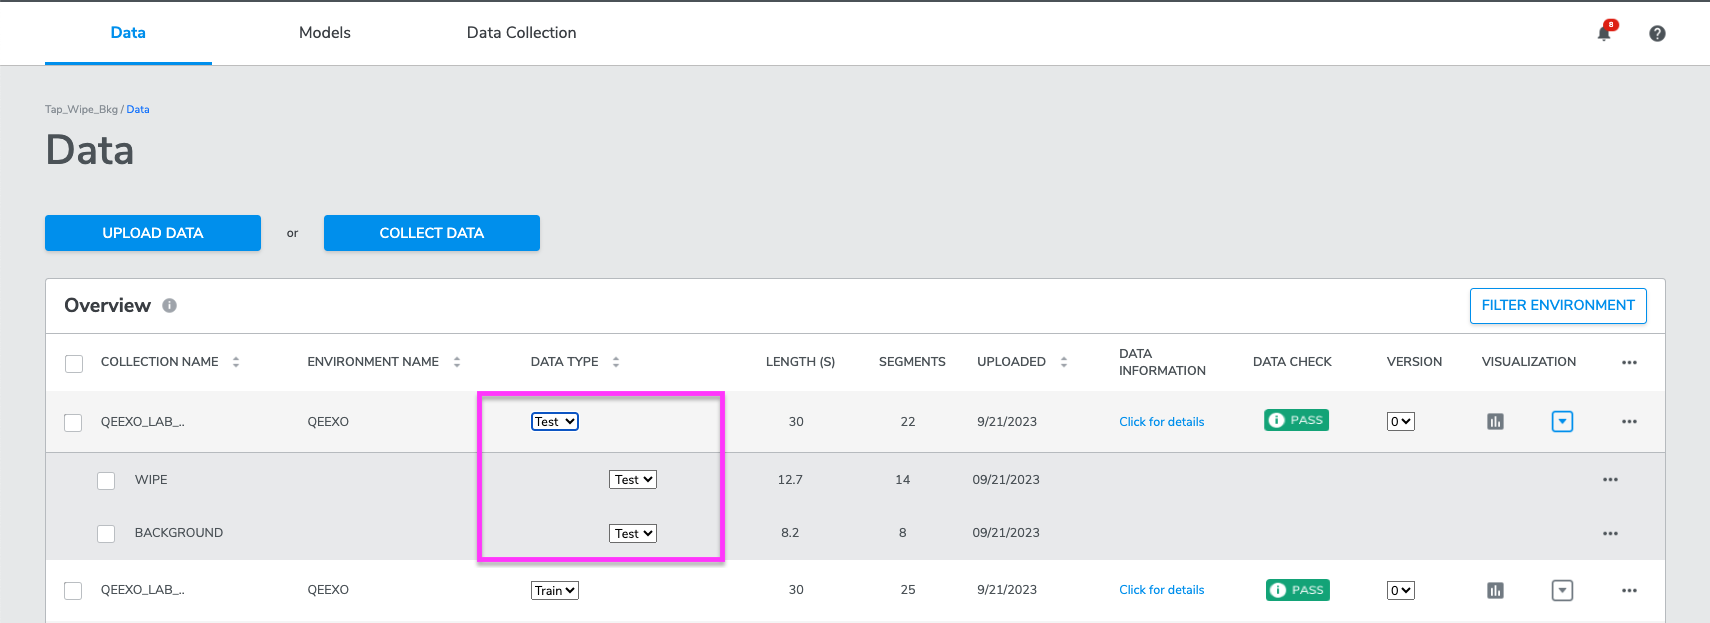
4-2 Test data
Test data is a set of data instances used to evaluate the performance of a trained model. To designate a collection as Test Data simply select the Test designation from the DATA TYPE dropdown on any data row. Please note, modifying the data type for a particular collection will change the data type designation for all class labels within that collection.
4-3 Training and test data operations
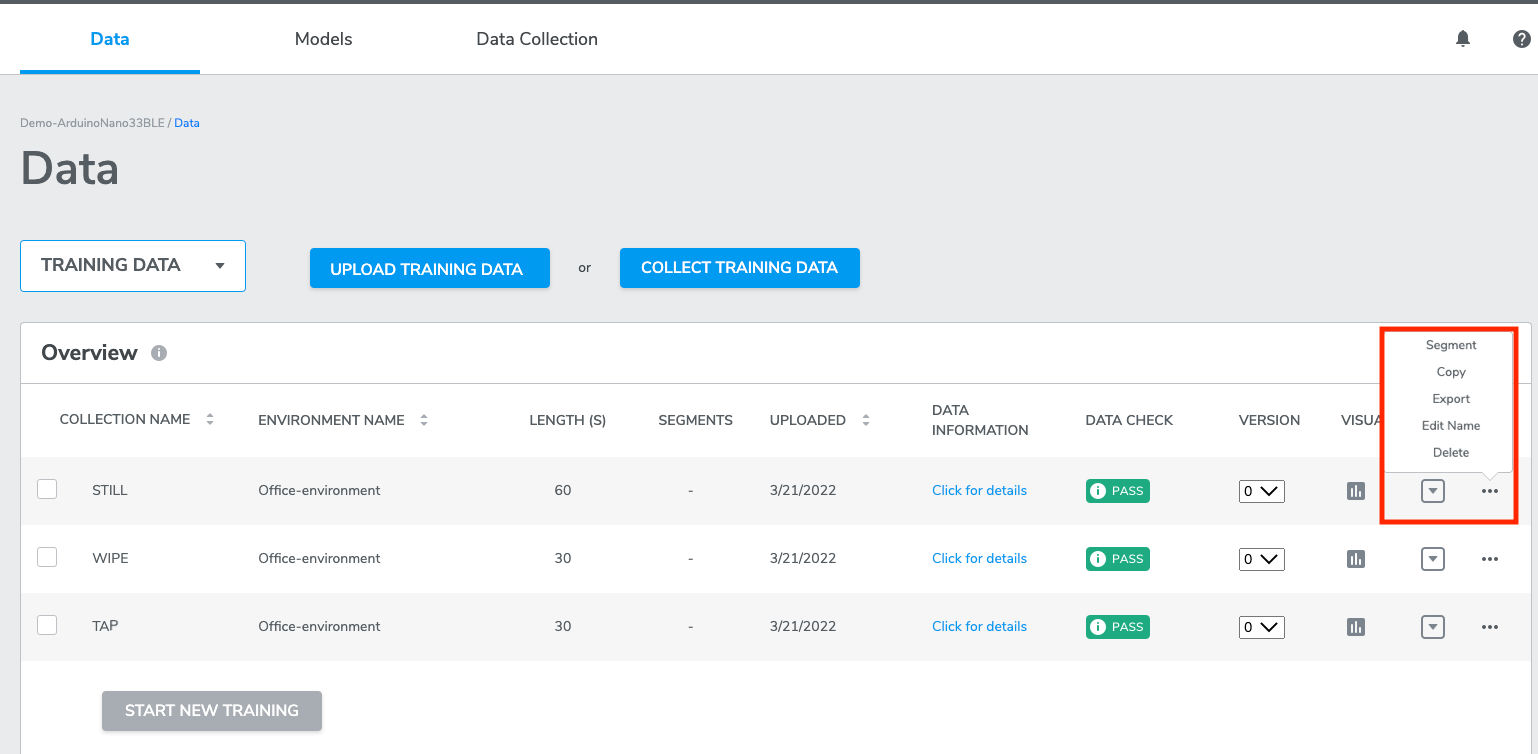
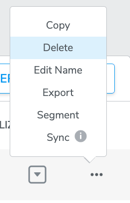
AutoML provides operations for users to manage their data collections and imports directly from training or test data. Current options include:Segment, Copy, Export, Edit Name, Edit Label, and Delete.
4-3-1 Copy operation
The Copy operation allows users to copy training or test data from a source project to one or more destination projects. The source and destination project(s) MUST be of the same device kind.
To copy a dataset from a source to one or more destination projects, click the Copy option located in the ellipse ... operations menu for the desired dataset (shown as picture above). From the resulting modal, locate and click one or more destination projects and click Copy.
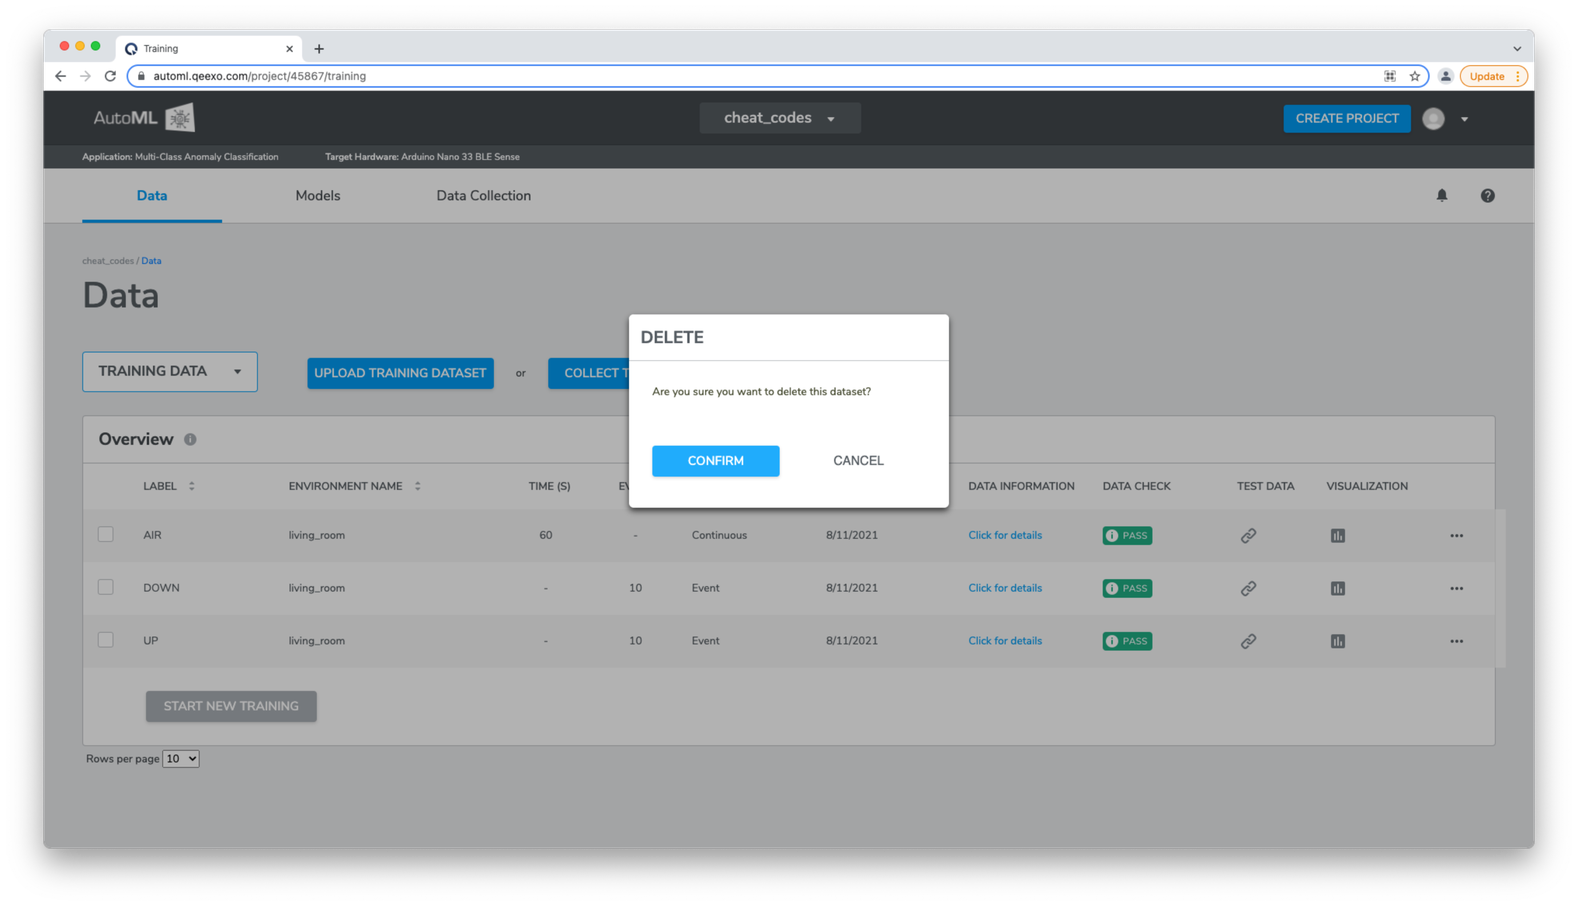
4-3-2 Delete operation
The Delete operation allows users to delete training or test data that has not been associated with a model build.
To delete training or test data from a project, click the Delete option located in the ellipse ...operations menu for the desired dataset. From the resulting modal, click CONFIRM.
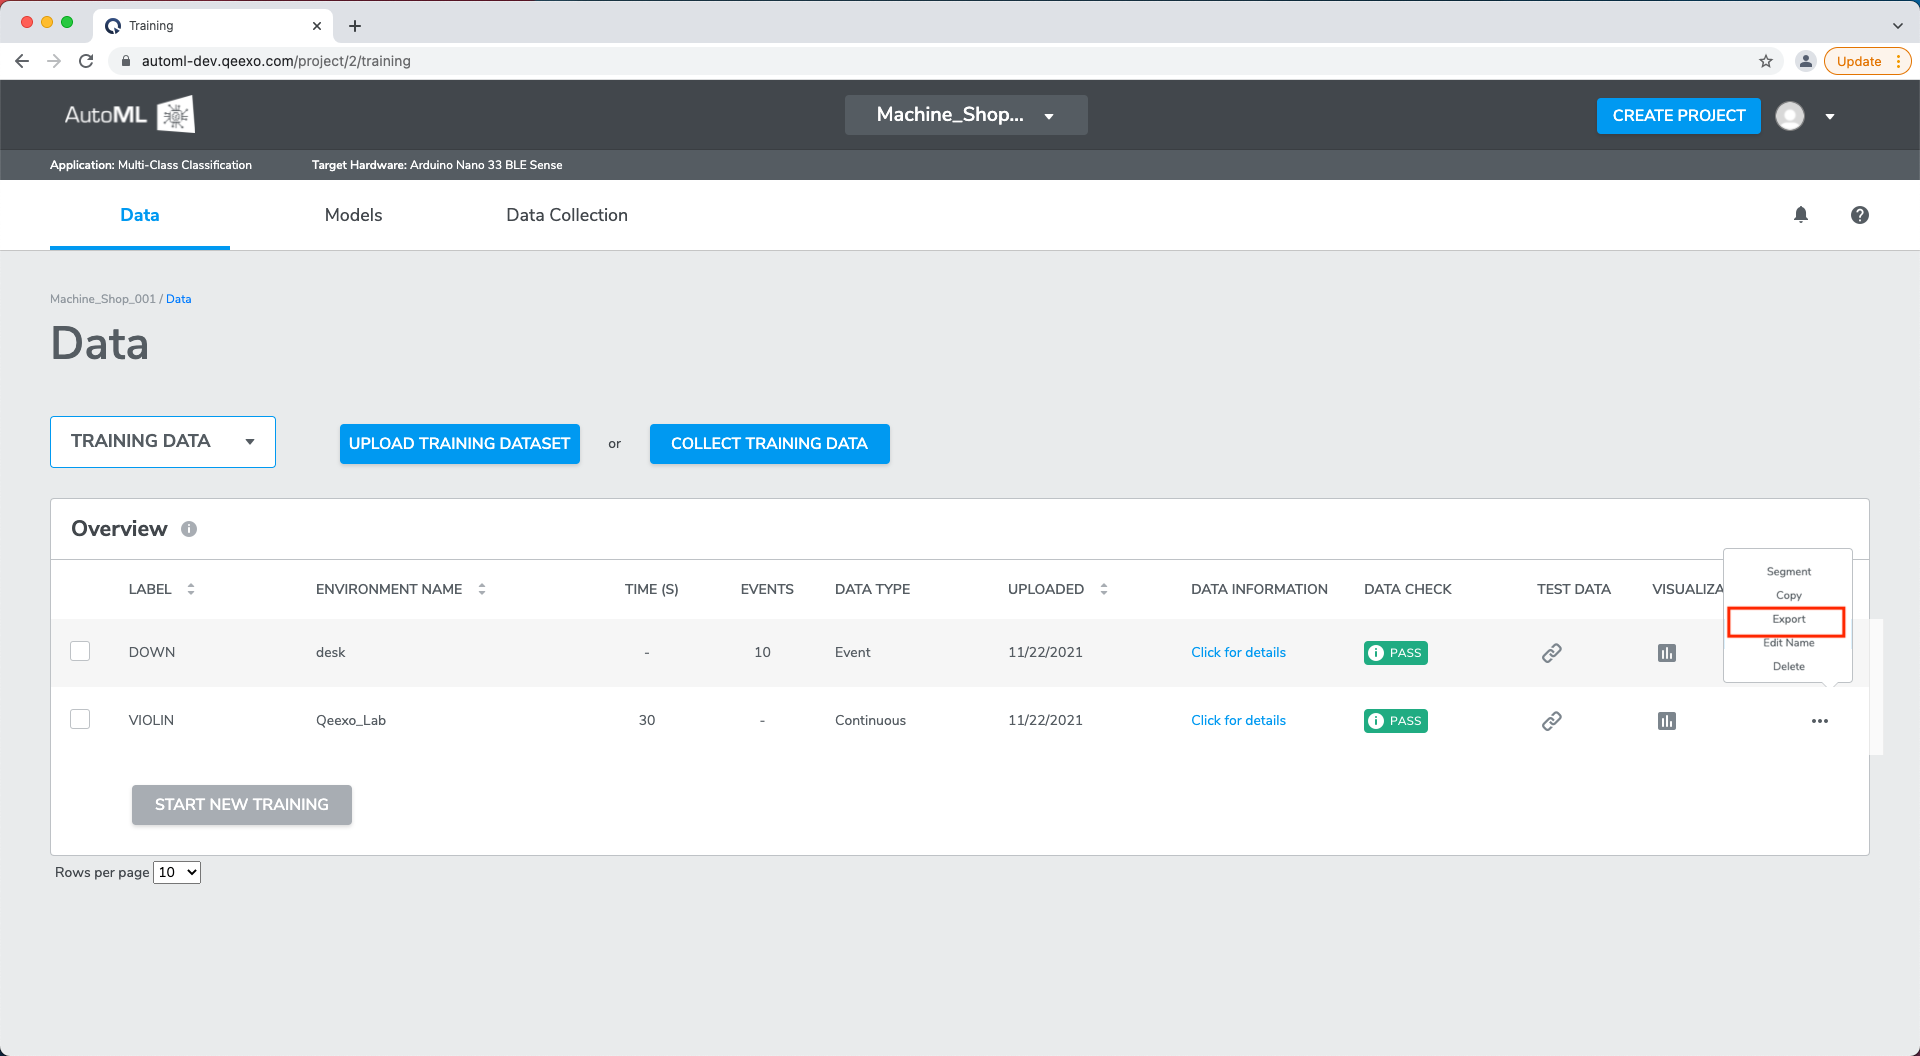
4-3-3 Export operation
The Export operation allows users to export training or test data to a .csv file in Qeexo AutoML format.
To export training or test data from a project, click the Export option located in the ellipse ...operations menu for the desired dataset to initiate the download, specify the destination if requested.
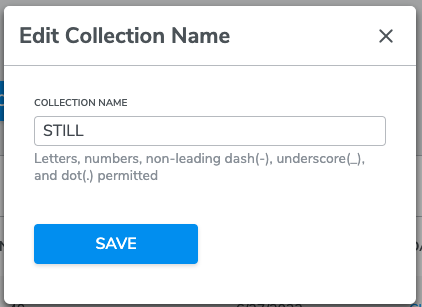
4-3-4 Edit Name operation
The Edit Name operation allows users to modify data collection name and make it explainable to themselves.
To modify the name of a collection, click the Edit Name in the ellipse ...operations menu for the desired data collection. A window will pop up and you can edit the collection name. Click SAVE to update.
4-3-5 Edit Label operation
The Edit label operation allows users to modify the given class label of one or more training or test datasets that have not been associated with a model build.
To modify the class label for a single collection, click the following two buttons shown in the picture.
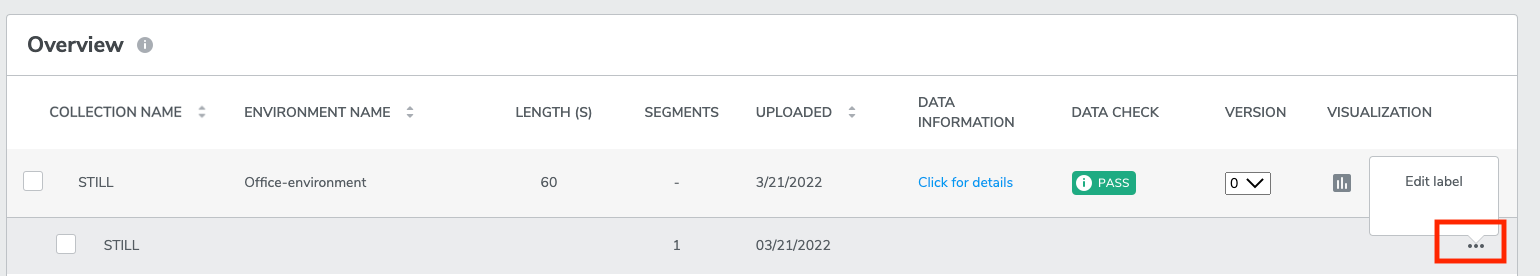
Then provide a new or existing class label for the collection and click UPDATE.
4-3-6 Segment operation
The AutoML data segmentation feature allows you to locate, crop, and label events from your collection displayed in the data visualization editor for use as training or test data.
*Once segments are created and included in training, a version history allows you to recall and modify past segment sets, and then retrain your models in effort to achieve the highest performing model possible.
4-3-6-1 Creating Segments
From the training or test data pages, start by clicking on the … ellipse menu and select the Segment option to load the segmentation data visualization editor.
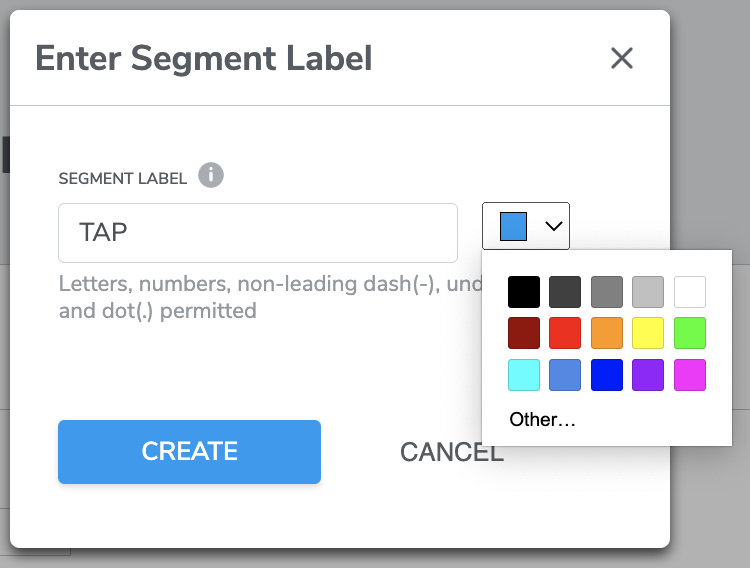
IN DEMO CASE We clicked CREATE NEW SEGMENT, a window will pop up where you can assign a desired segment label name - ‘tap’ and select a color. Click CREATE
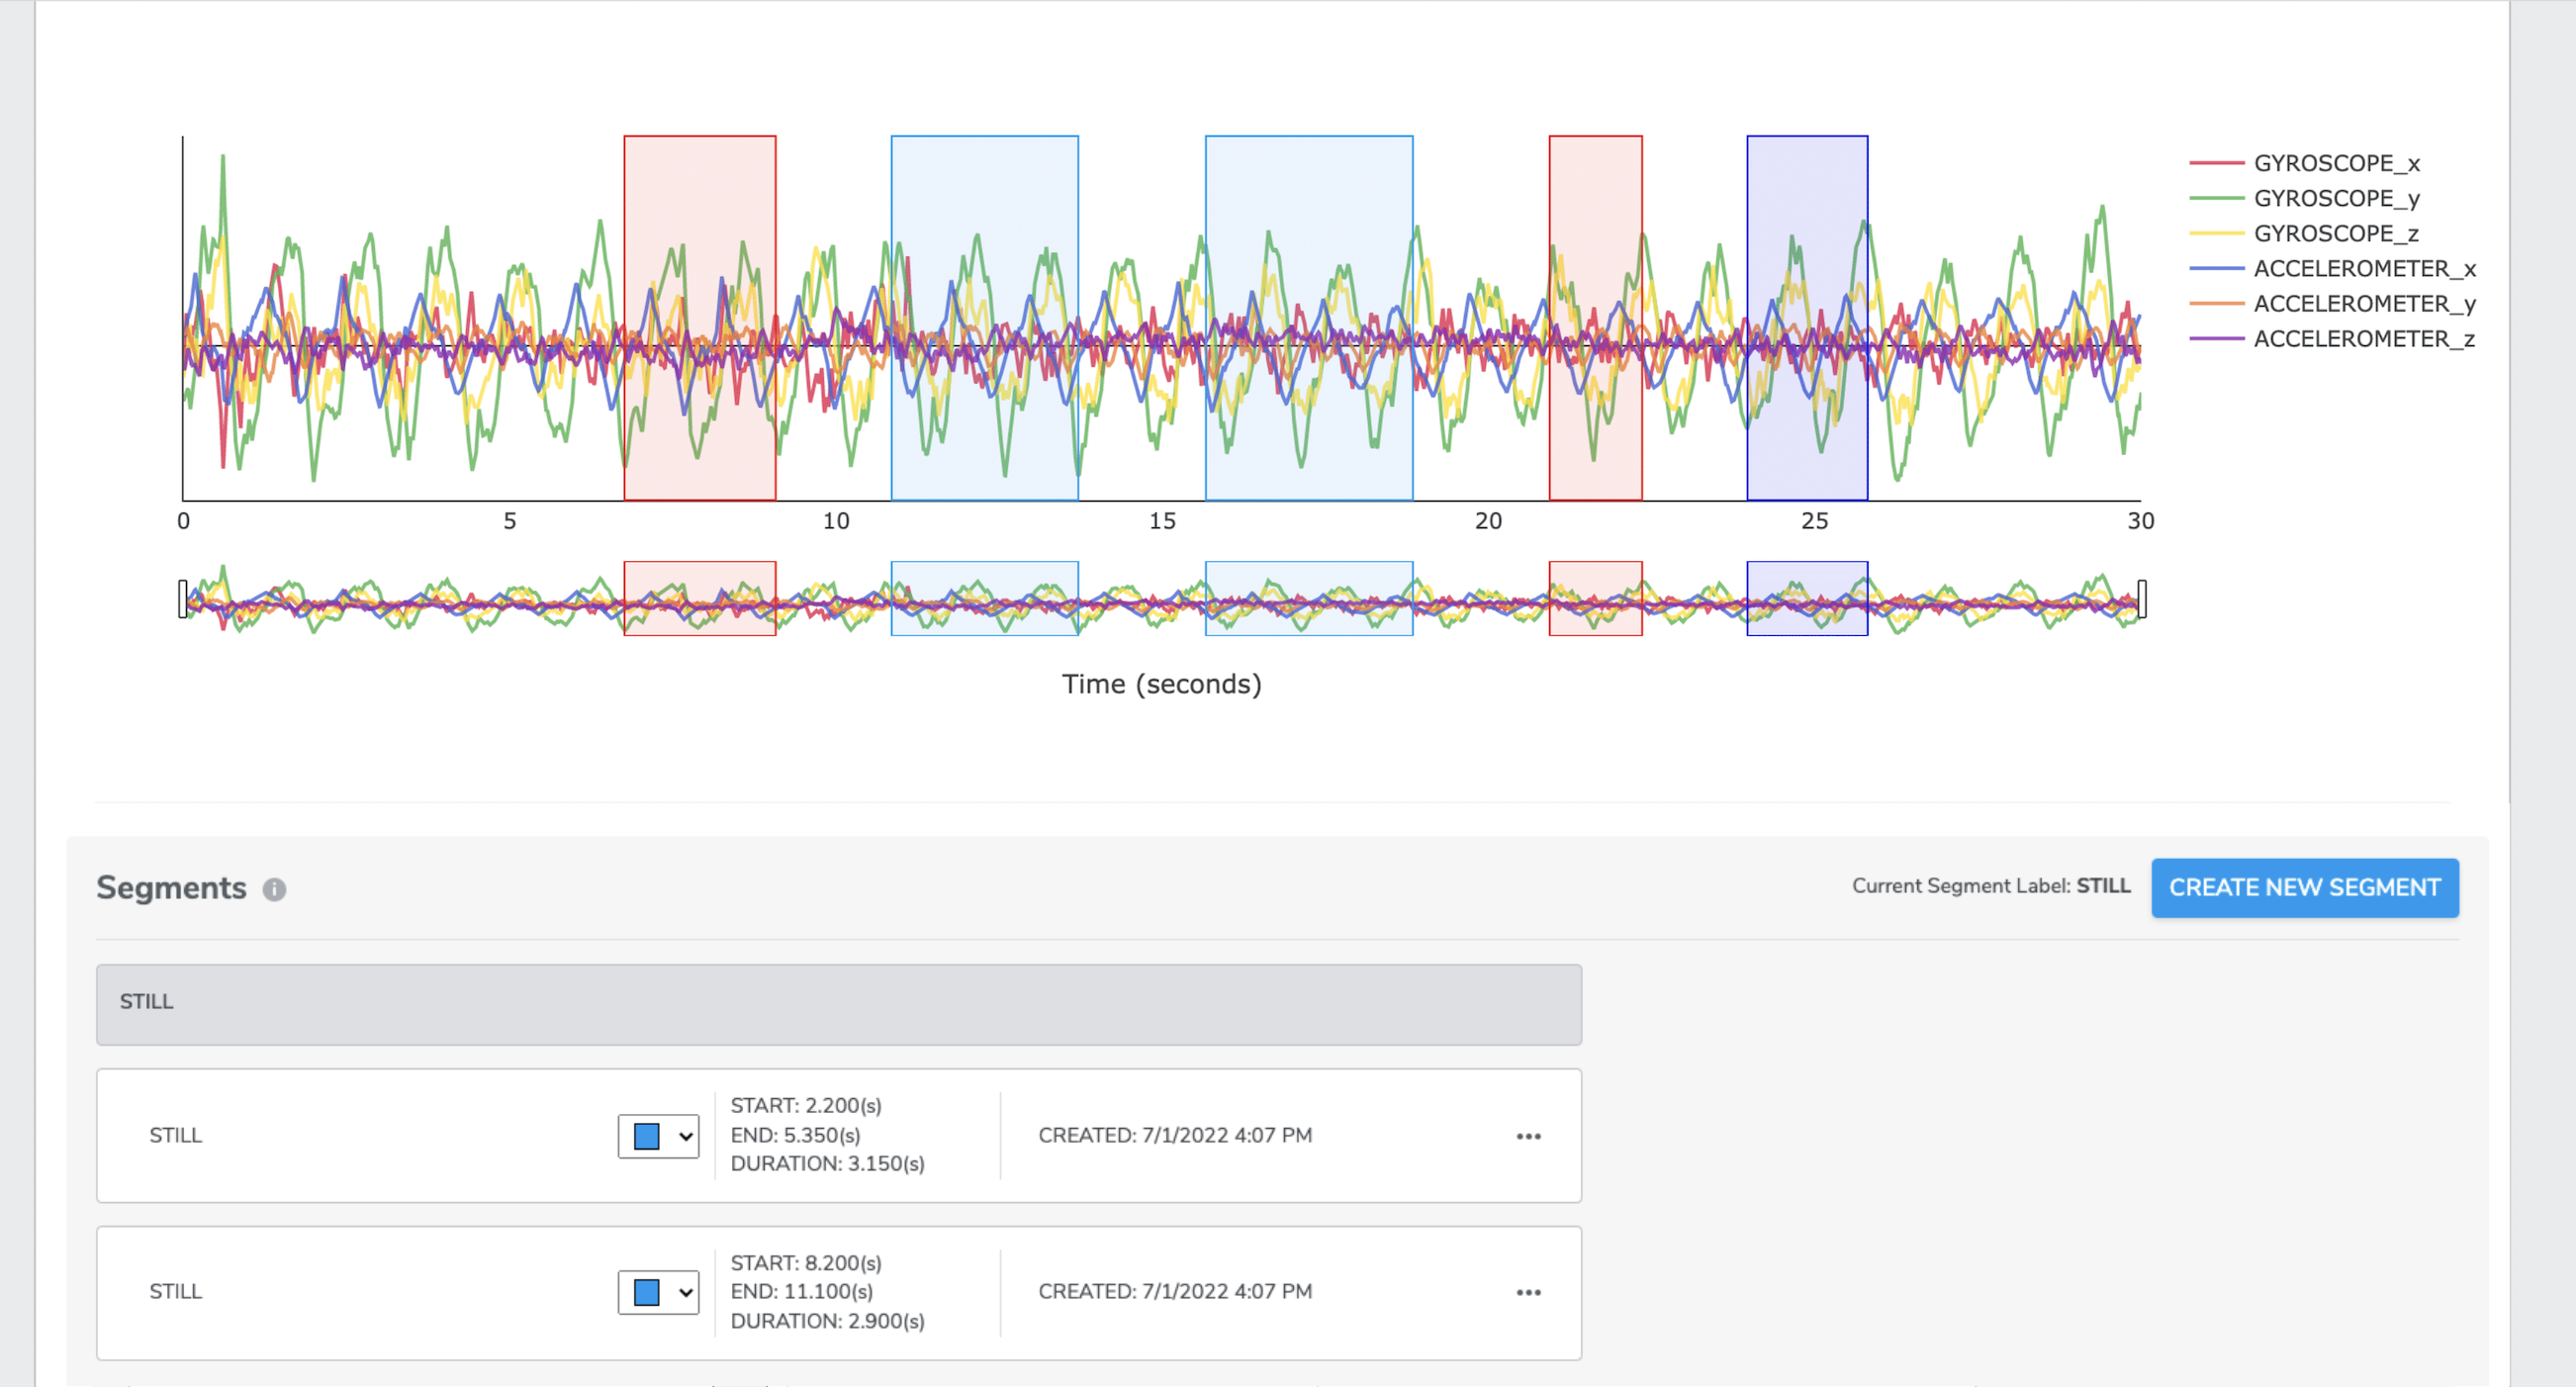
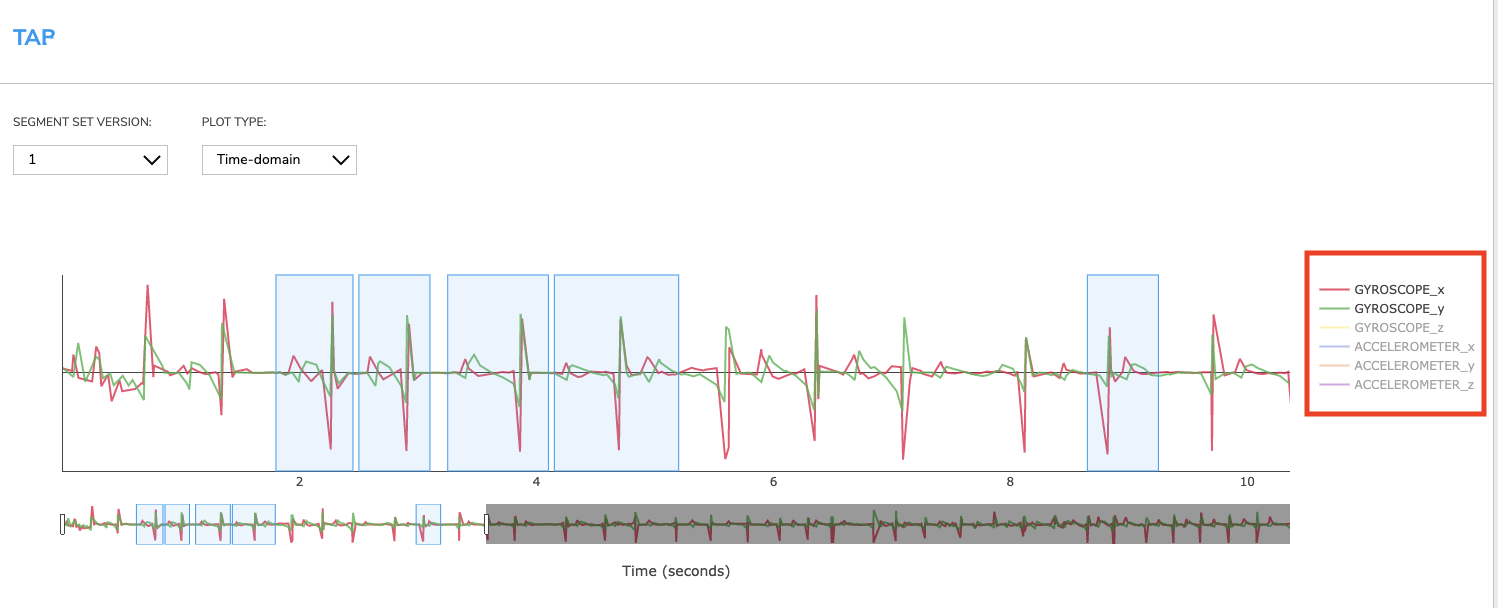
Then you will be back to segmentation page, use the drag bars and your mouse pointer to locate and zoom a region of interest. Next, click the start and end points of the desired events in the plot as many times as needed until no more event needed to be cropped.
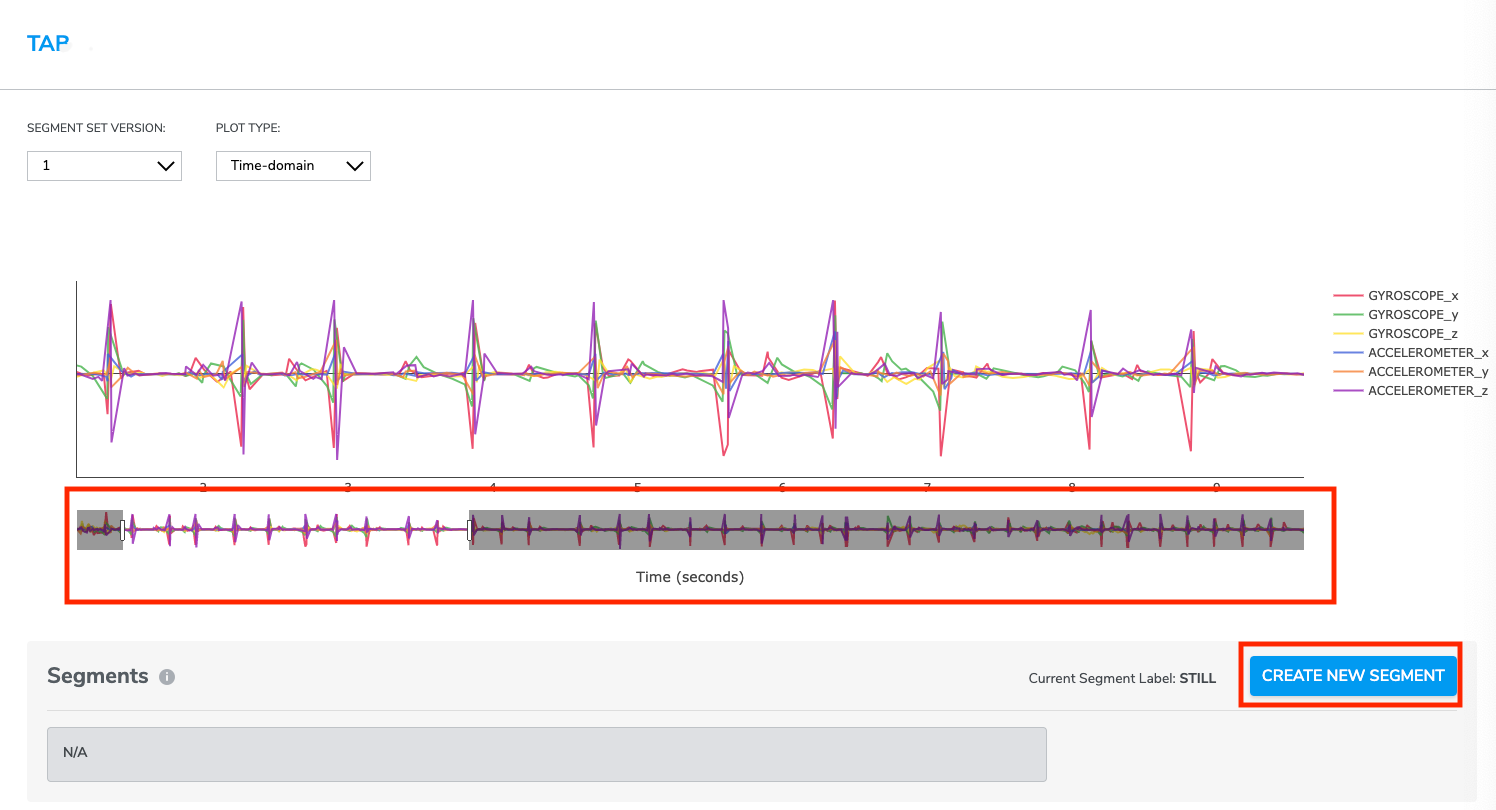
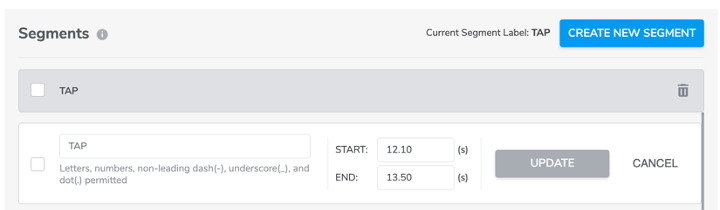
Every time a user creates a segment, the segment will automatically be displayed in the segments list under the data plot. Users have the option to edit (including name, duration (start and end time)) or delete it.
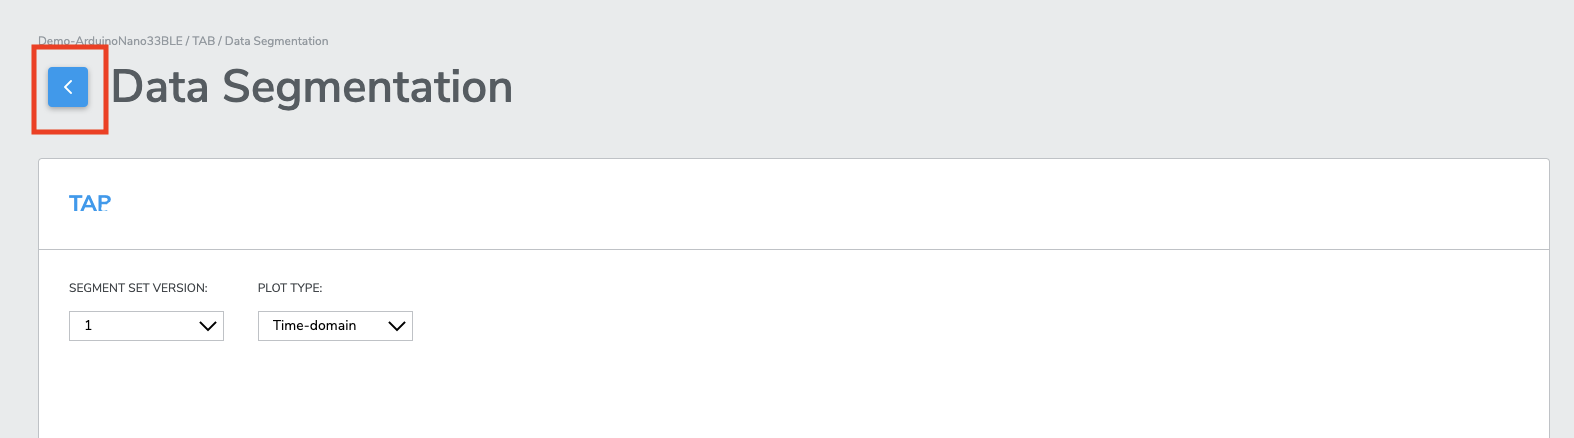
Once complete, use the dedicated back button to return to the Training or Test data pages and select any combination of compatible segmented and non-segmented data collections to start training.

To help users match the segments on the plot with the lines under plot, we have added a click and reveal feature to indicate the corresponding segments from the plot when the user clicks the segment’s checkbox.
4-3-6-2 Show / hide sensors & Axes
By default, Qeexo AutoML displays all enabled sensors data included in the collection across a single time or frequency visualization. Data visualizations for each sensor axis may be enabled or disabled by clicking on the individual axes from the sensor key. Optionally, double-clicking on an individual axis will enable or disable data visualizations for all other axes.
*Note: disabling the data visualization for any number of individual axes does not exclude those axes from data segmentation, all enabled sensors data is included in each segment regardless of visualization.
4-3-6-3 Modifying / Deleting Segments
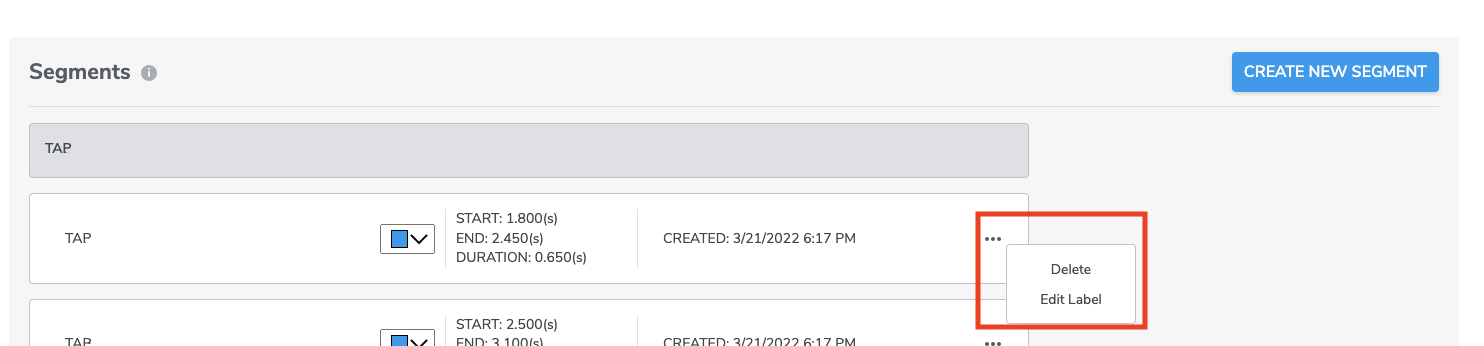
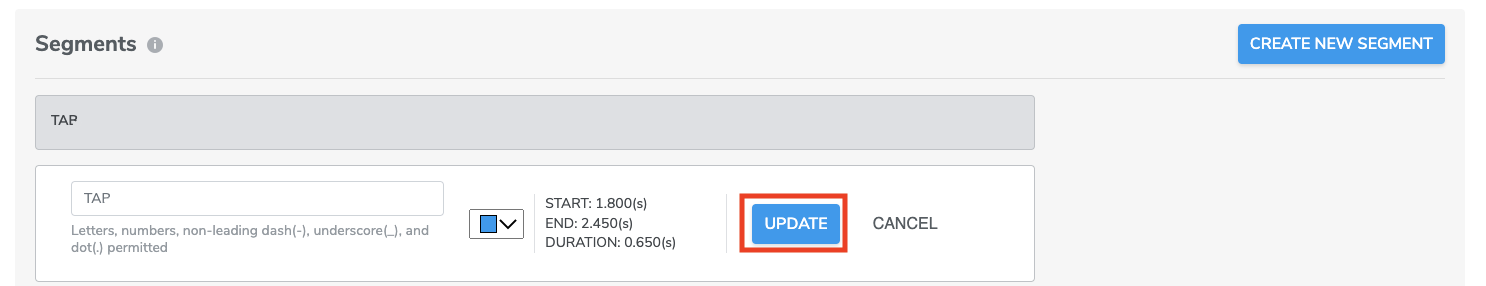
For our latest version, Qeexo AutoML data segmentation feature allows for editing label. simply select Edit Label through the segment’s … ellipse menu. Then you can assign a new label name, then click UPDATE.
However, at this moment, Qeexo AutoML data segmentation feature DOES NOT allow for editing of a segment’s start / stop point selection. In order to modify a segment following creation, simply select Delete through the segment’s … ellipse menu and recreate the segment using the process above.
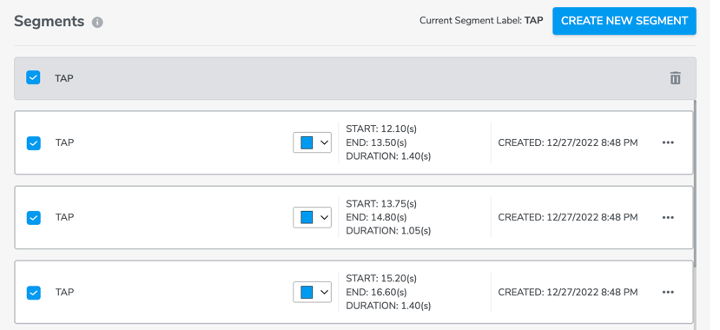
Additionally, by clicking the check box to the top left of the segment label list, it will select all segments that are under same label. Users could also click the trash button on top right to delete all selected segments at once.
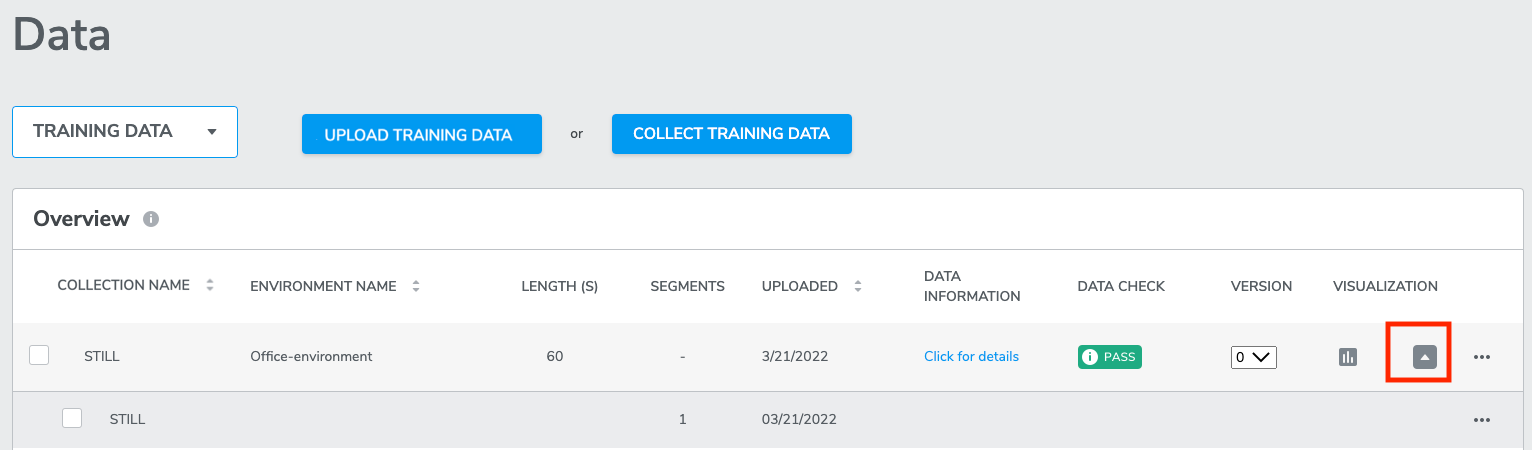
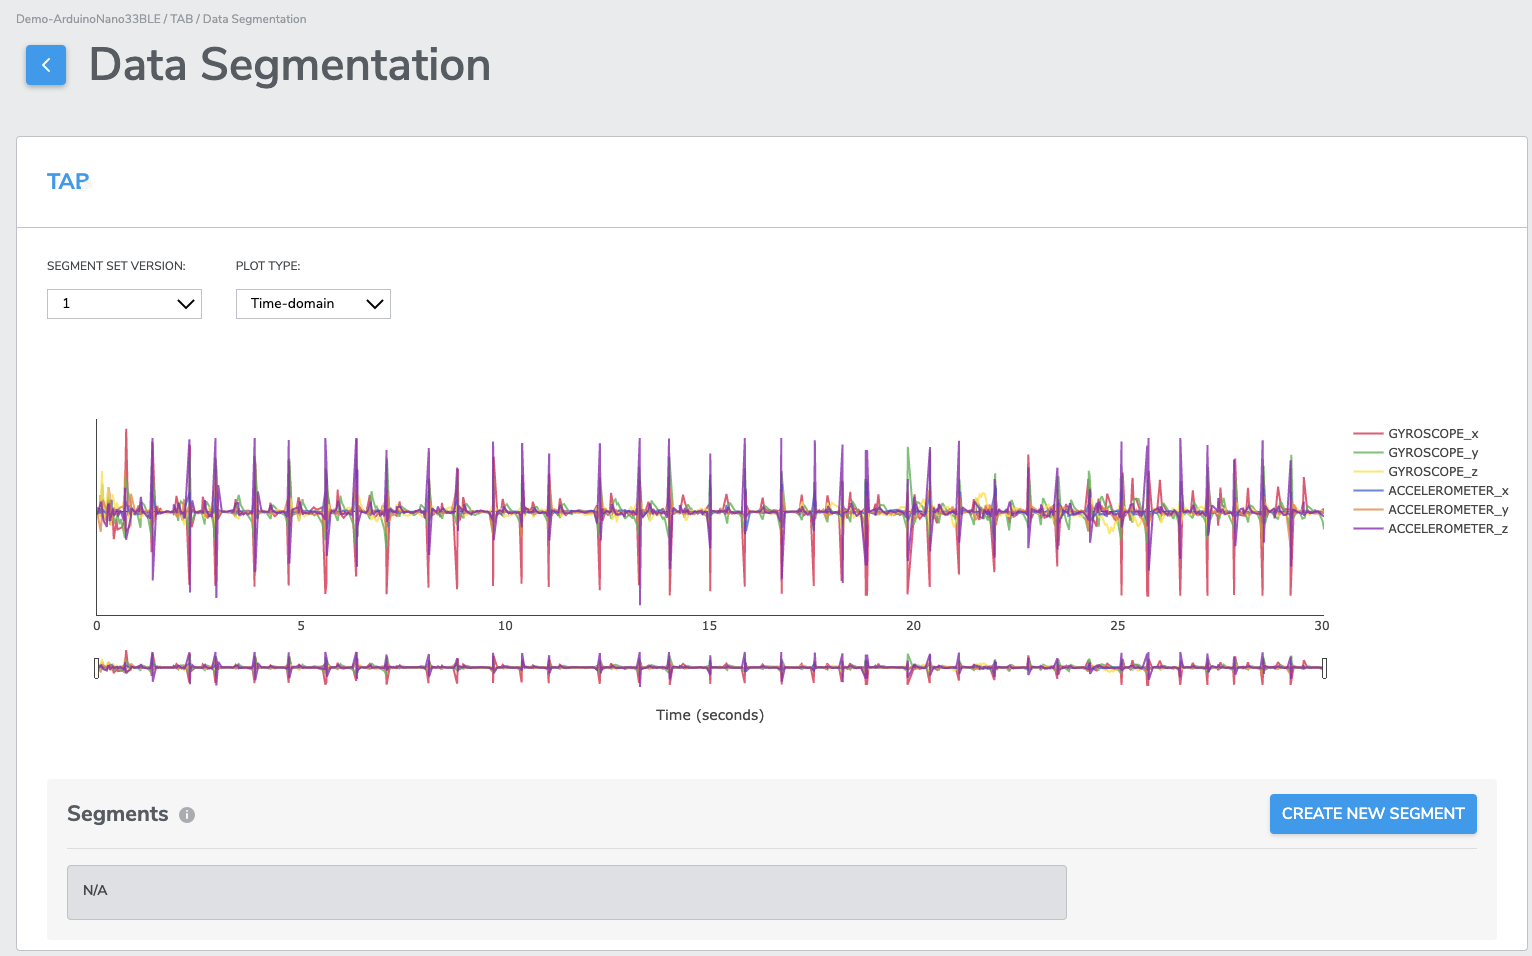
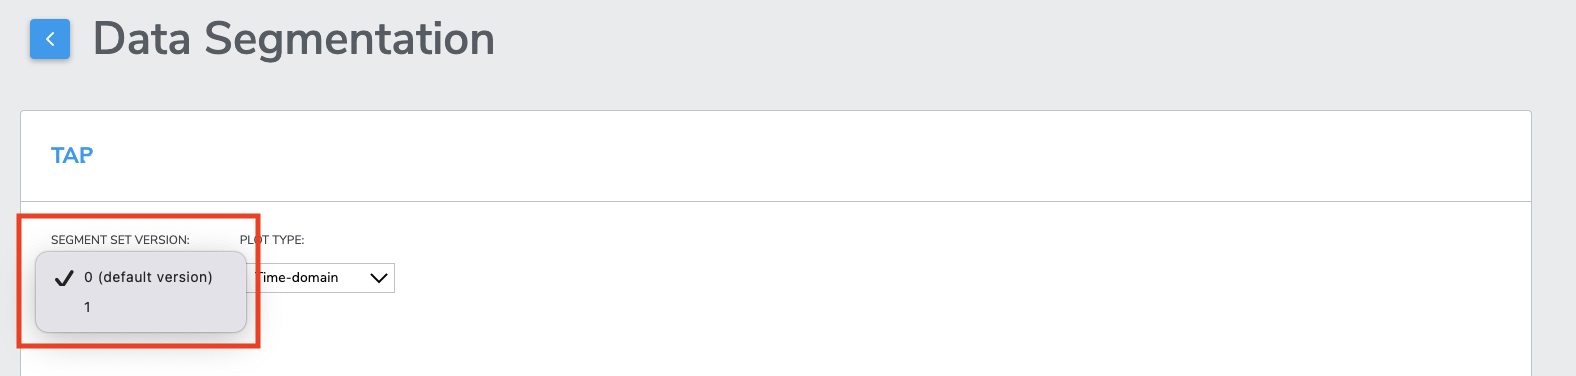
4-3-6-4 Segmentation version history
At the time of training Qeexo AutoML saves a recallable SEGMENT SET VERSION of your segments, selecting any available version from the SEGMENT SET VERSION drop-down menu will restore the segments for that collection. Once restored, new segments may be created and / or existing segments may be deleted before using the collection in training.
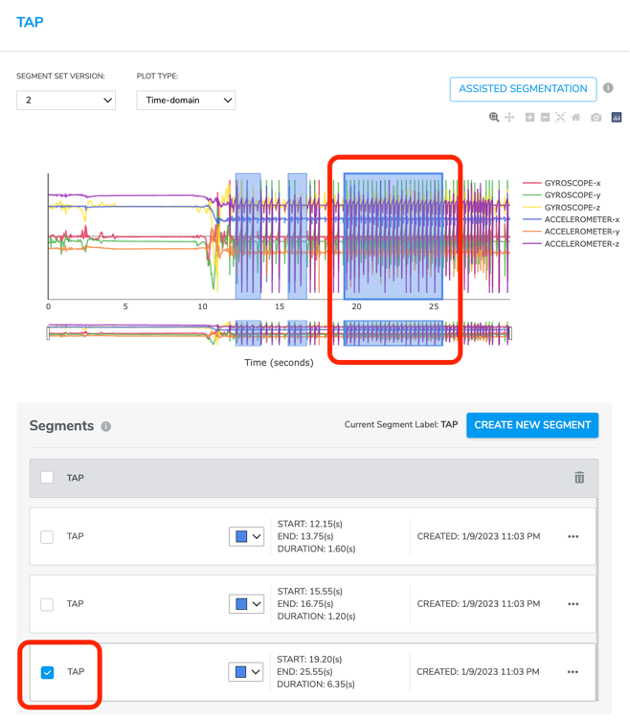
4-3-6-5 Assisted Segmentation
Assisted Segmentation provides users with a quicker way to crop a data collection into segments. Users only need to manually crop a few (at lest one) segments for each label then us Assisted Segmentation to help detect those data points that share the same information.
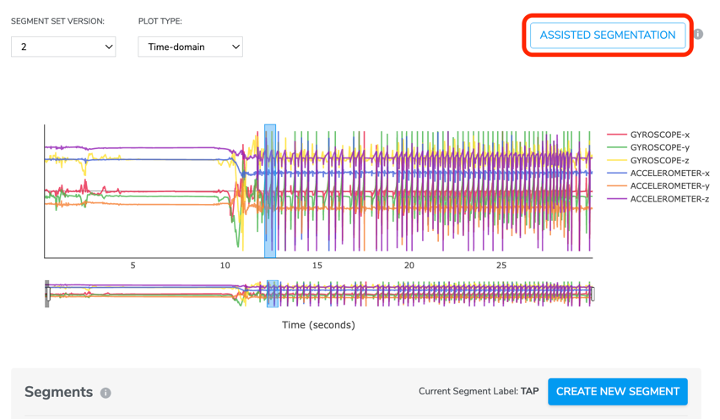
Click CREATE NEW SEGMENT, create a segment label, click the start and end point on data plot to crop a segment.
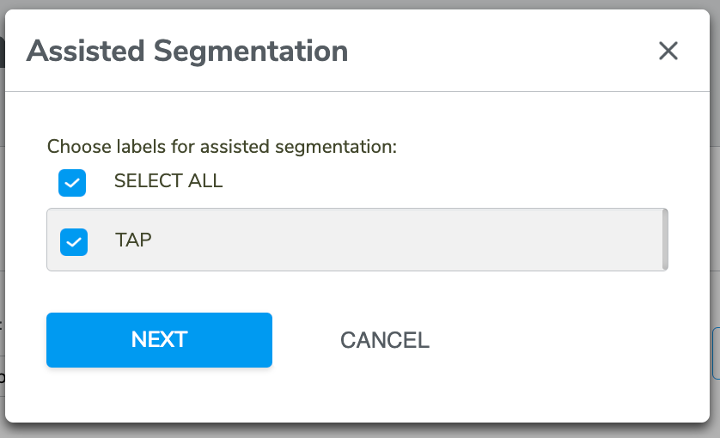
Then click ASSISTED SEGMENTATION button on the top right. There will be a pop-up window for users to select segment label(s) for assisted segmentation.
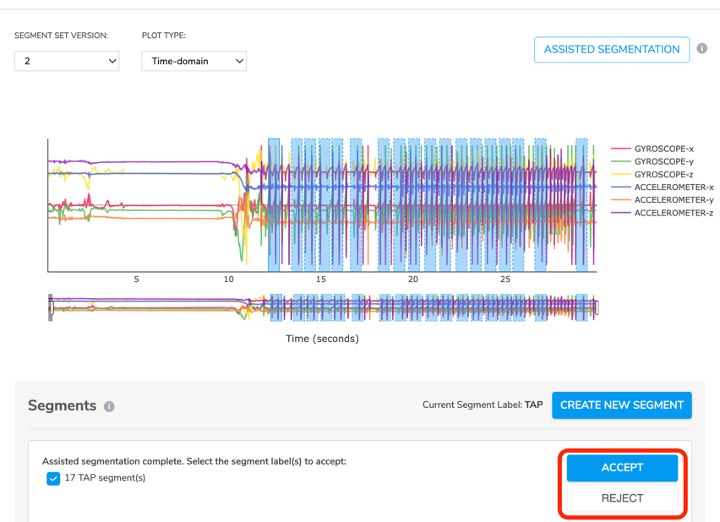
Clicks NEXT, Qeexo AutoML will detect the segments for the un-cropped areas and list them on both the data plot and segments list below. Users could either ACCEPT or REJECT the result depending on how satisfied you are with the segmentation.
4-3-7 Sync Operation
From time to time after collecting data, transmission to Qeexo AutoML servers may be interrupted, this is typically evidenced by broken / incomplete visualizations, or data check errors. If this occurs, you may try using the sync feature to complete the uploading of any data that remains on your local disk.
4-4 Test data evaluation
A test dataset can be associated with at most one training dataset, both must share the same sensor configuration.
When a test dataset is linked to a training class label, it will be used to evaluate the performance of the final model created using said training data.
Consider the following example: For a multi-class classification project applied to activity tracking, you want to evaluate the model performance against actual users. You first collect/upload test data for two groups, users age 18 - 64 and user age 65+, you then link the test label to the corresponding training label you want to evaluate against (ex: running-test-68-john and running-test-38-beth to running-training and walking-test-68-john and walking-test-22-beth to walking-training). You will see the overall test data accuracy and other matrix after the model is done training. Later, let's say you want to find out how the model performs for users age 65+, you can unlink all test datasets for users under the age of 65 from their corresponding training datasets, and then evaluate the changes, the result will give you an idea of what performance you can expect for users in the age group of 65+ using this particular machine learning model.
4-5 Evaluating test data
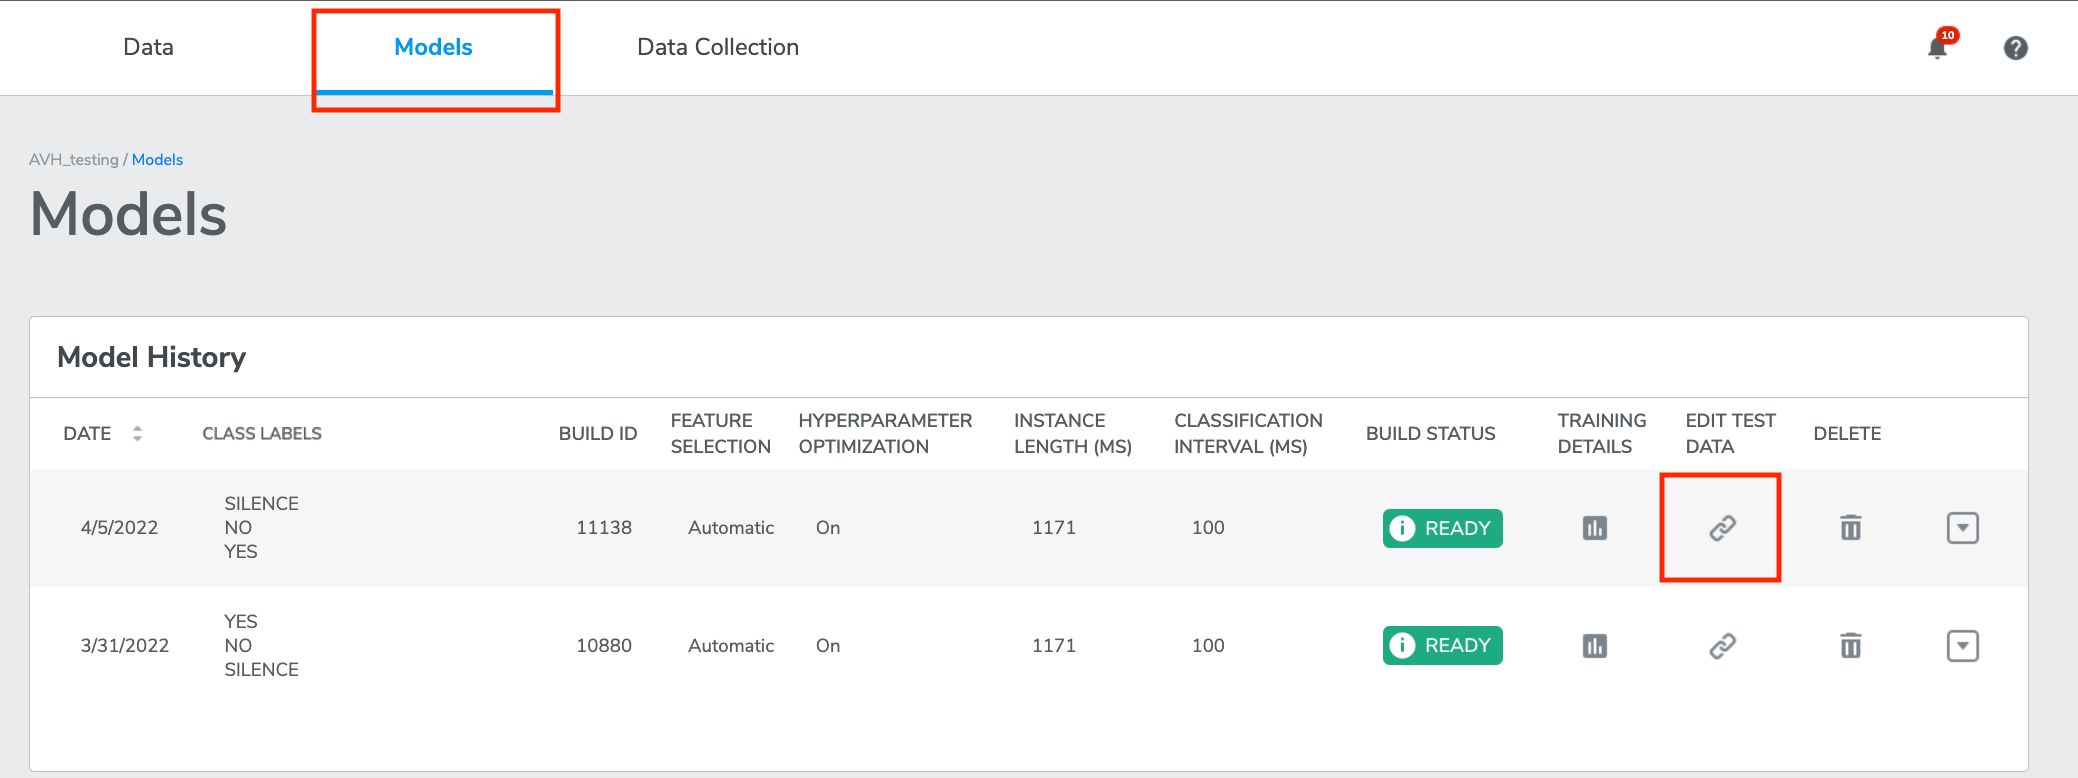
Test data may be collected or uploaded from the Test Data page. After test data has been ingested and a model has been trained, test data can be linked to evaluate the model's performance. (Please come back to this section after you had trained at least one model).
From the Models page, click the button under EDIT TEST DATA, a window will pop out.
Here test data collections on the left may be linked to training data collections on the right by clicking the checkbox for the row and selecting the desired training collection form the drop-down.
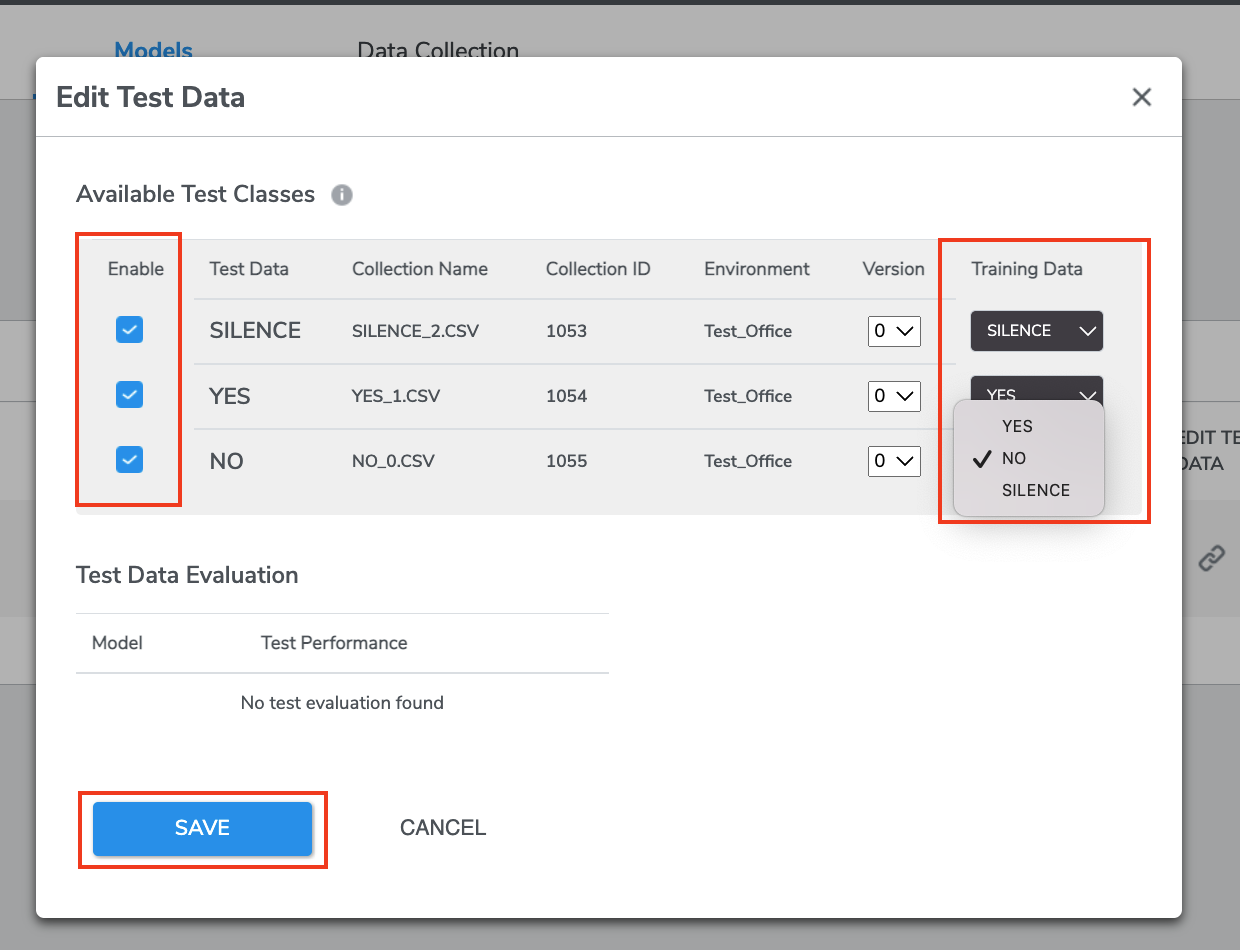
Select at least one data by clicking the check button on the left. Clicking “SAVE” will dispatch the test run and evaluate the model's performance using the linked test data.
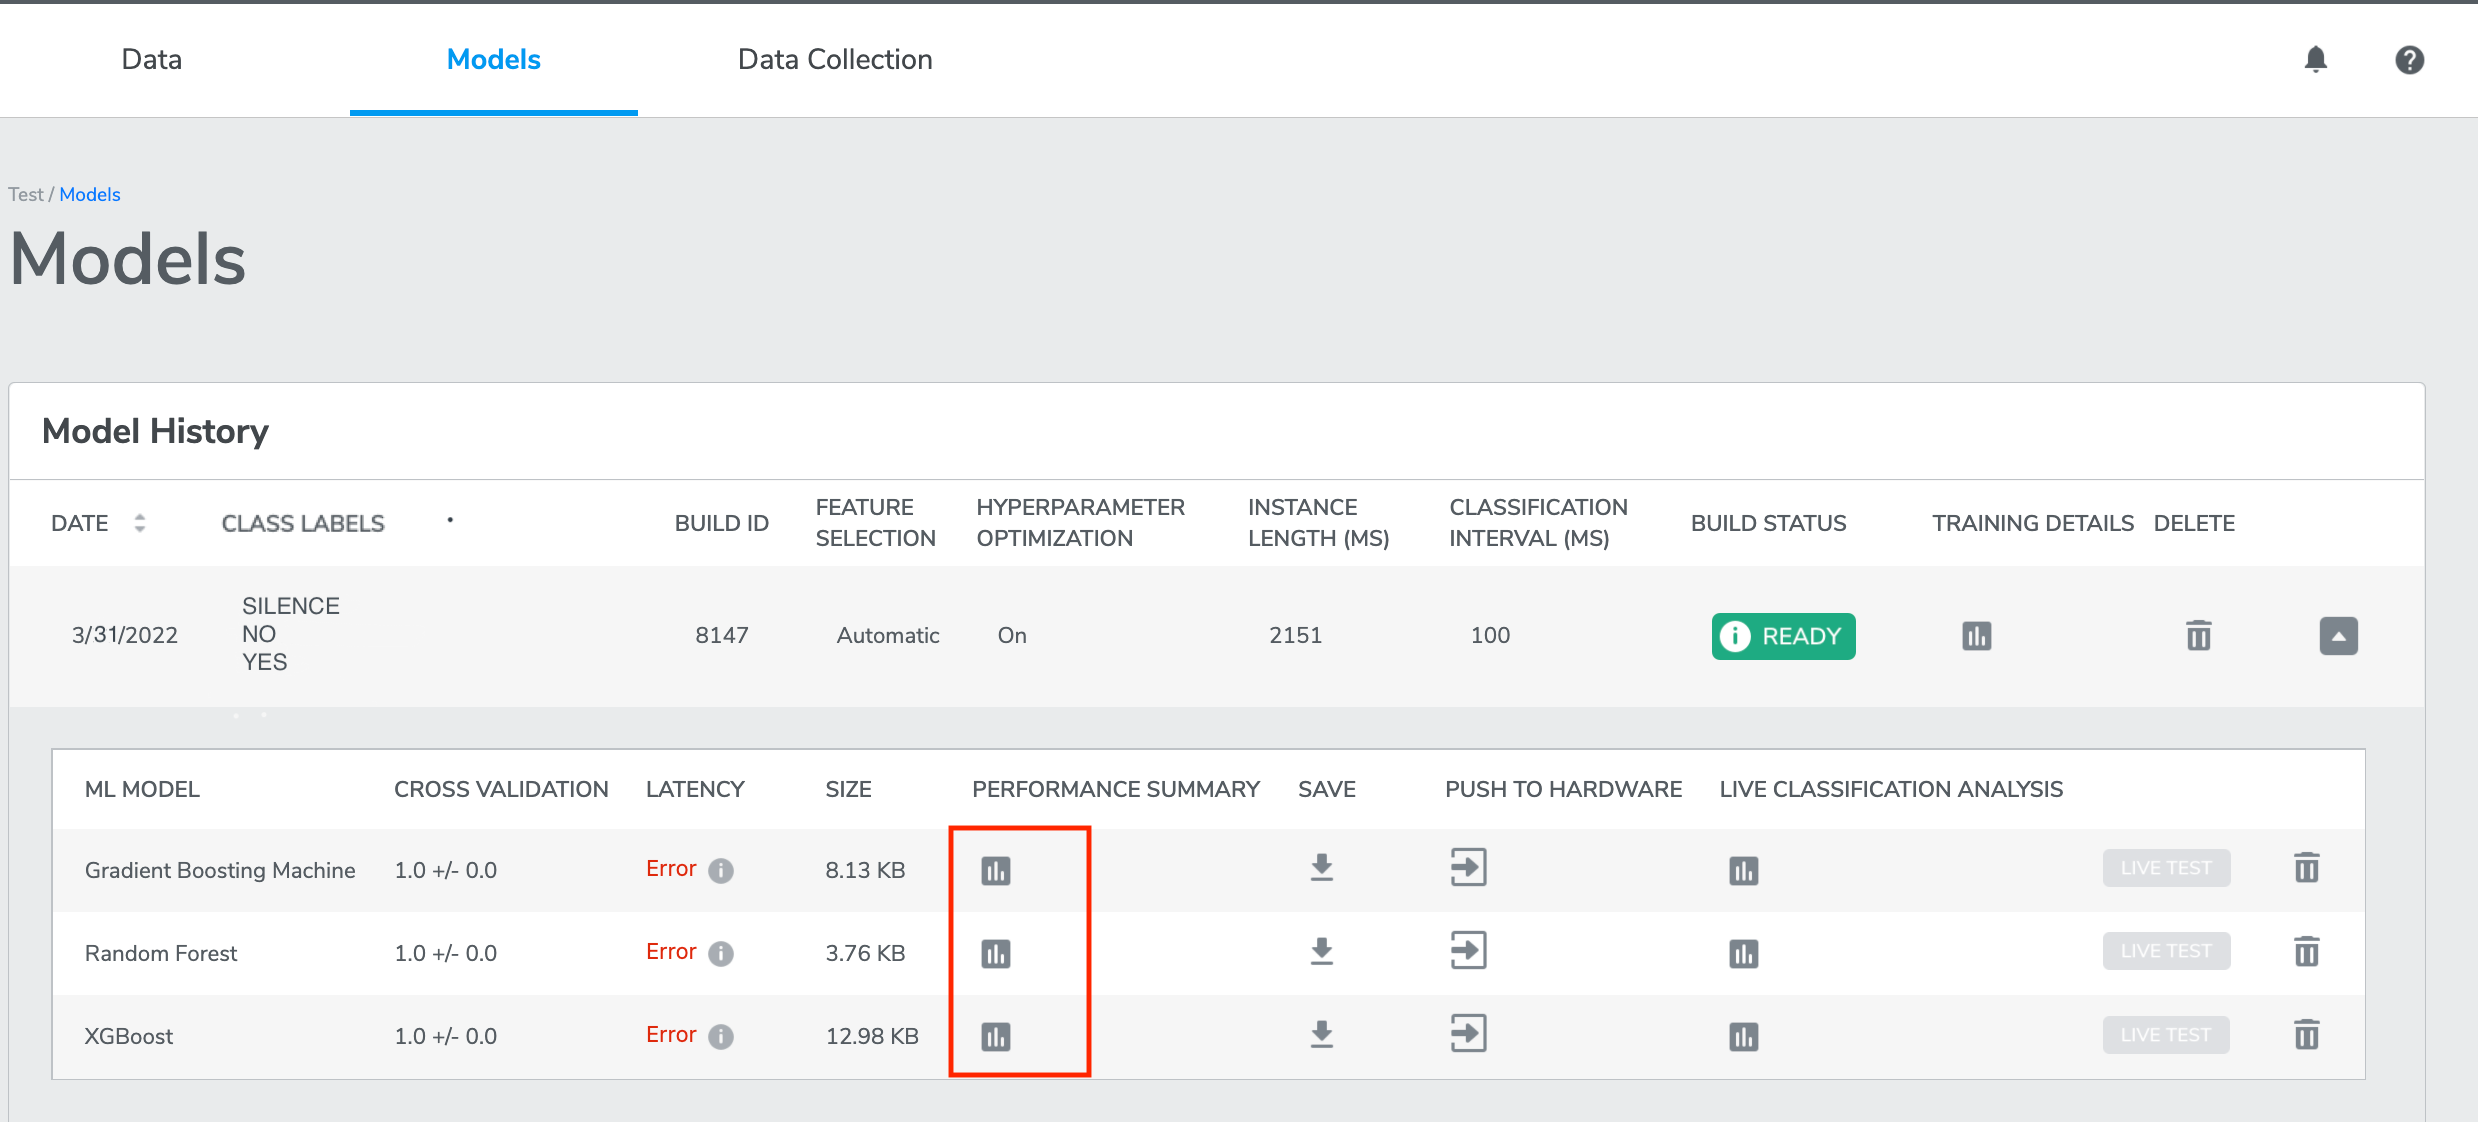
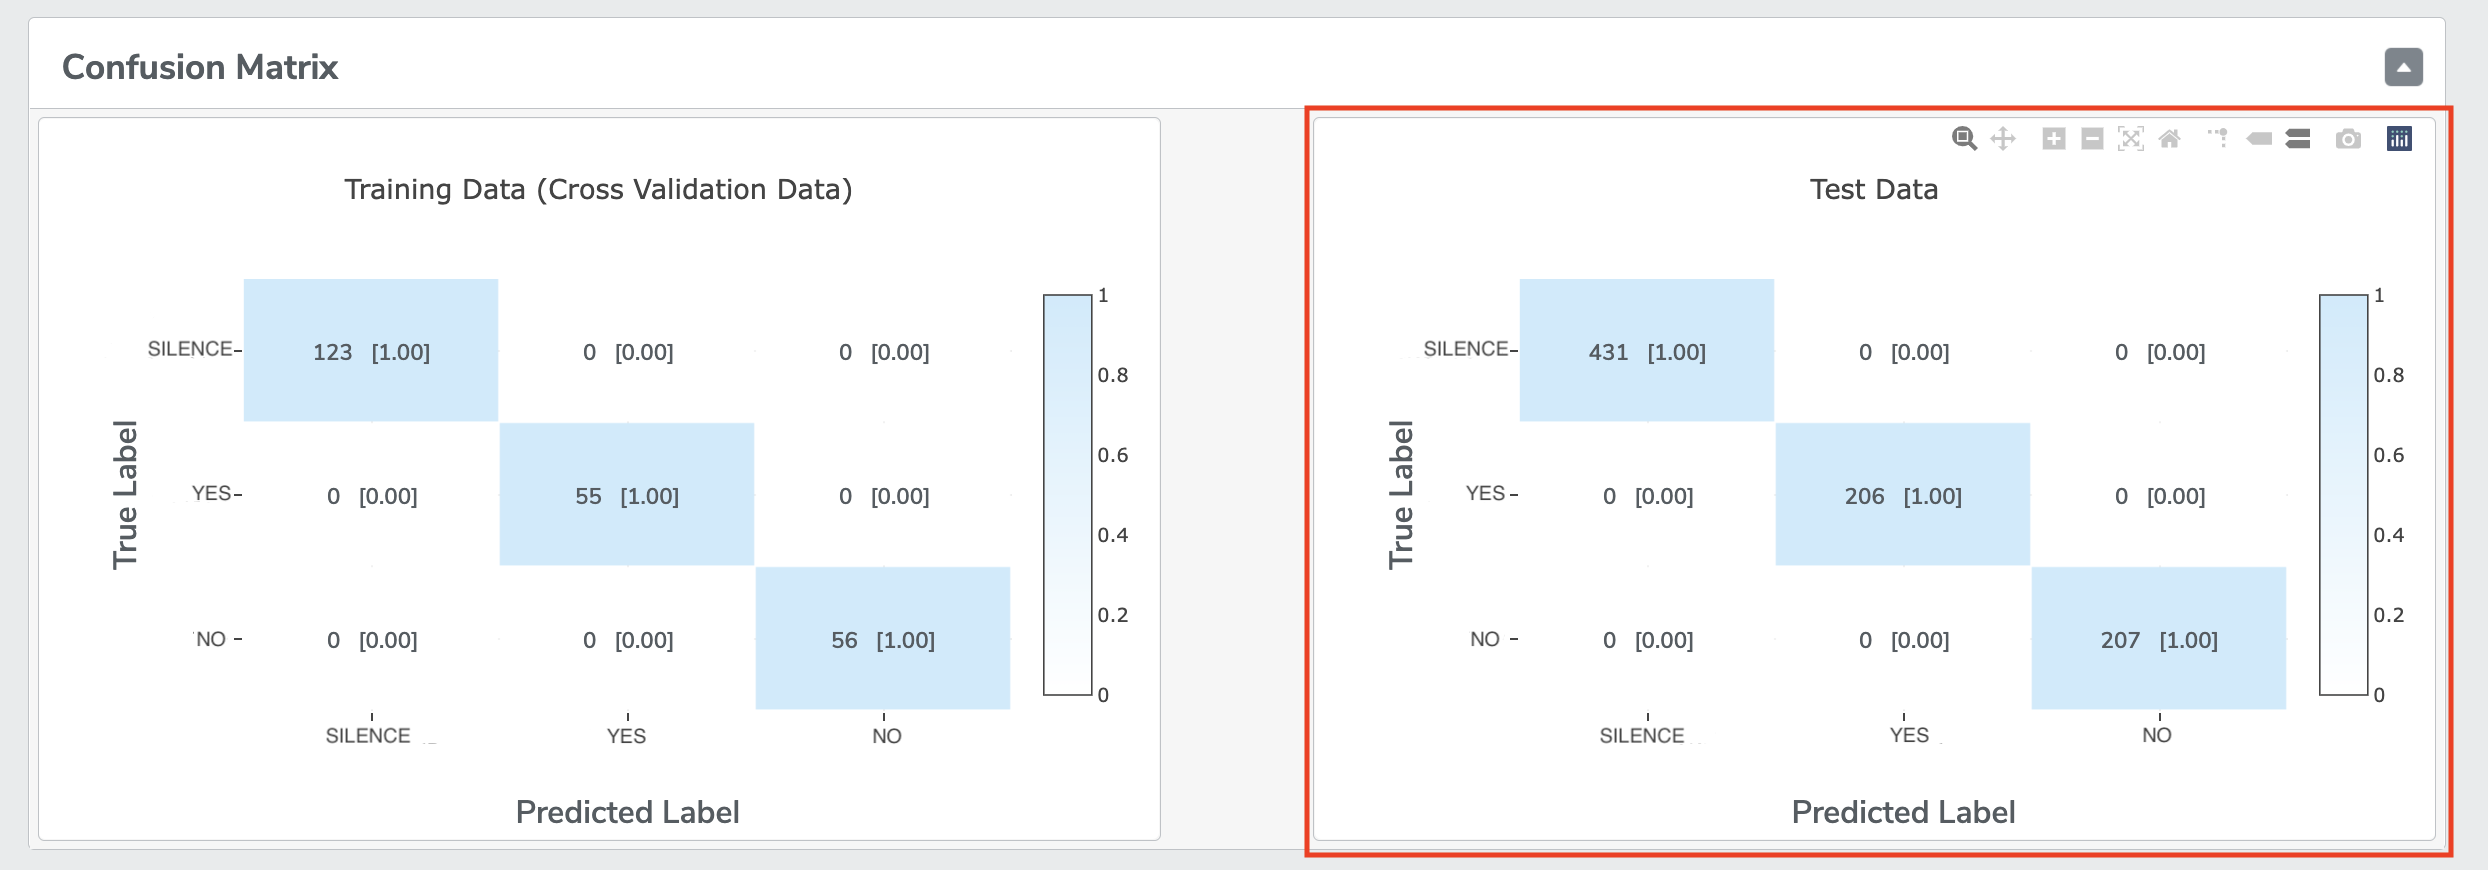
Once the evaluation is completed, you can find the result of Model performance on Test Data by clicking the buttons under “PERFORMANCE SUMMARY” of each model.
4-6 Test Data Replay
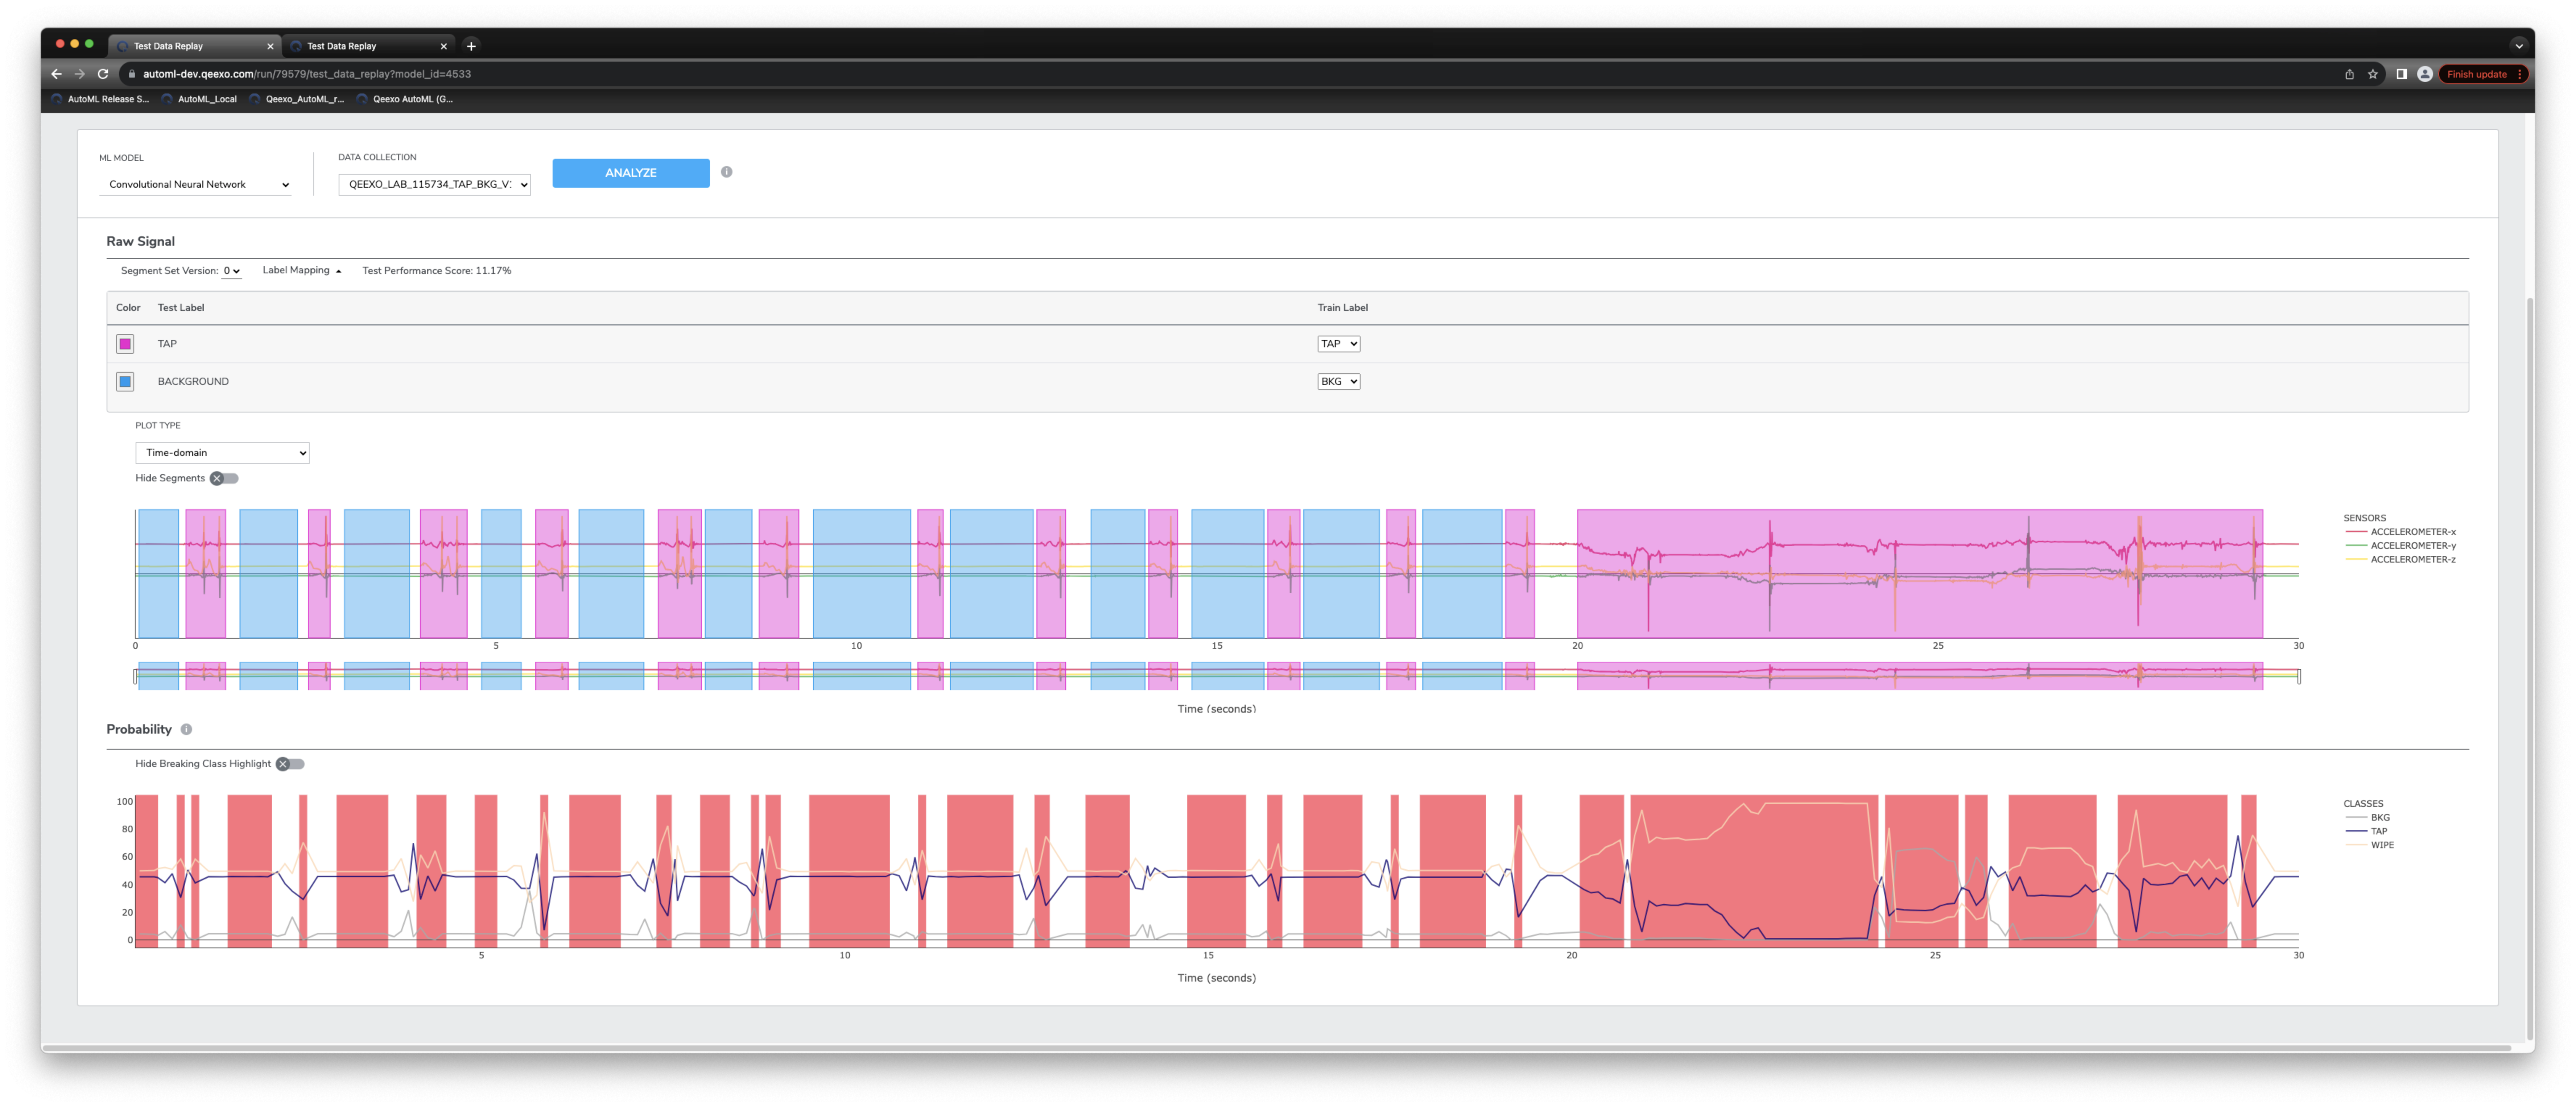
Test Data Replay is an asynchronous live testing feature providing linear test data analysis for each trained model, mimicking on-device sensor inference from a probability chart with plotted inference results and test performance score.
Start by choosing a test data collection from the DATA COLLECTION drop-down and select your Segment Set Version. If you have labeled test data, you can optionally match your training labels with test labels here. Next click ANALYZE, when the analysis is complete the system will return a probability graph with plotted inference results. Hovering over the graph at different points displays the change in inference results from one point in time to another.
When performing test data analysis on labeled test data, the system will automatically display Breaking Classes on the probability chart, these red-shaded regions indicate areas where labeled data differs from the inferred results. Both breaking class and segment regions can be hidden from their respective plots.
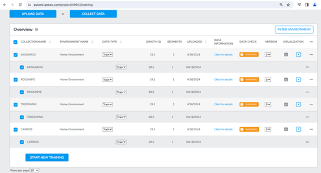
5. Viewing and managing project data
All of the Datasets associated with the current Project can be viewed and managed from the Data page. You can review the Dataset Information including its Sensor Configurations and Data Check results, as well as visualize and delete them.
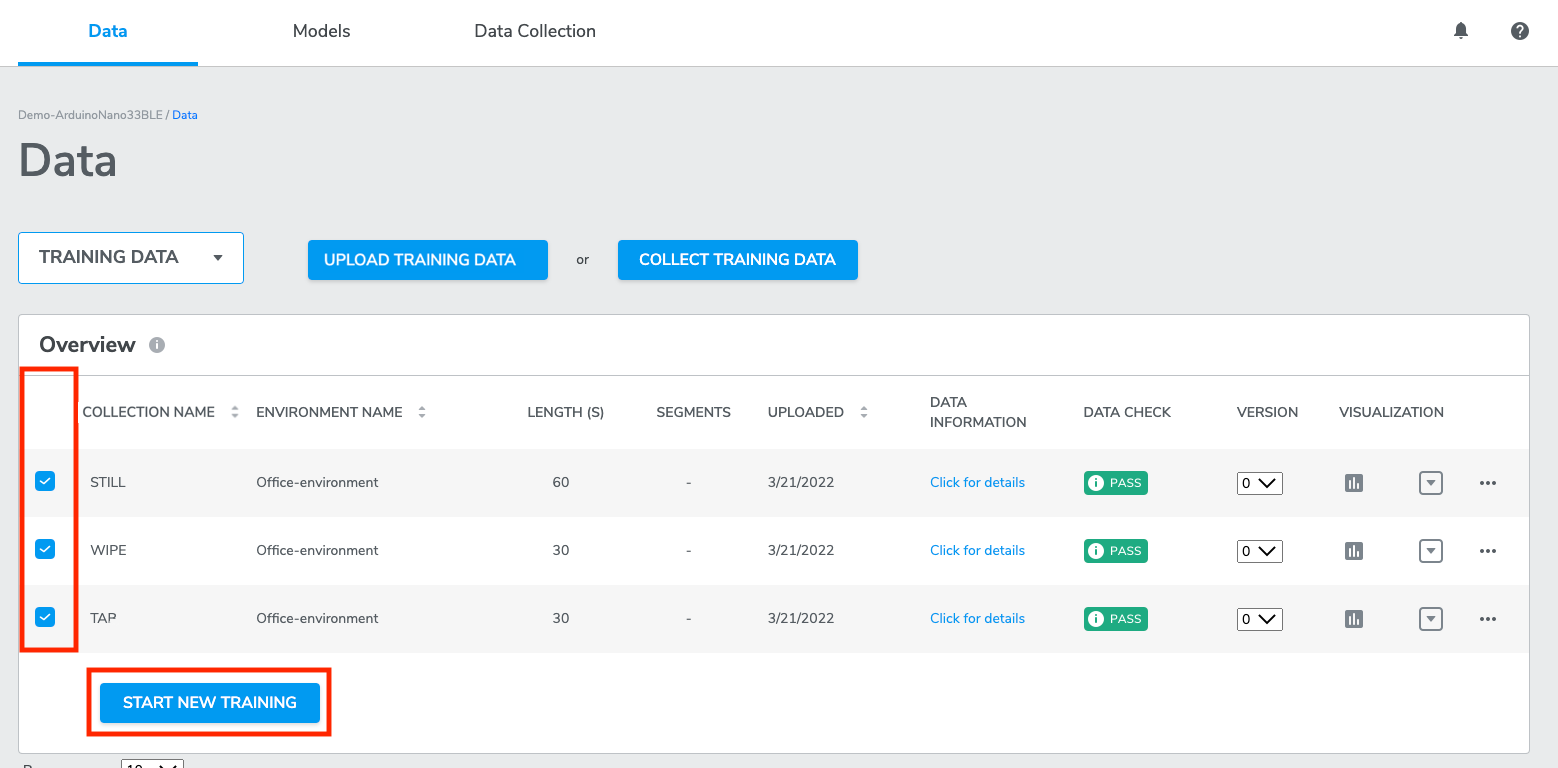
From this page, select Datasets containing more than one Class Label to begin training machine learning models. See Building Machine Learning Models for more information.
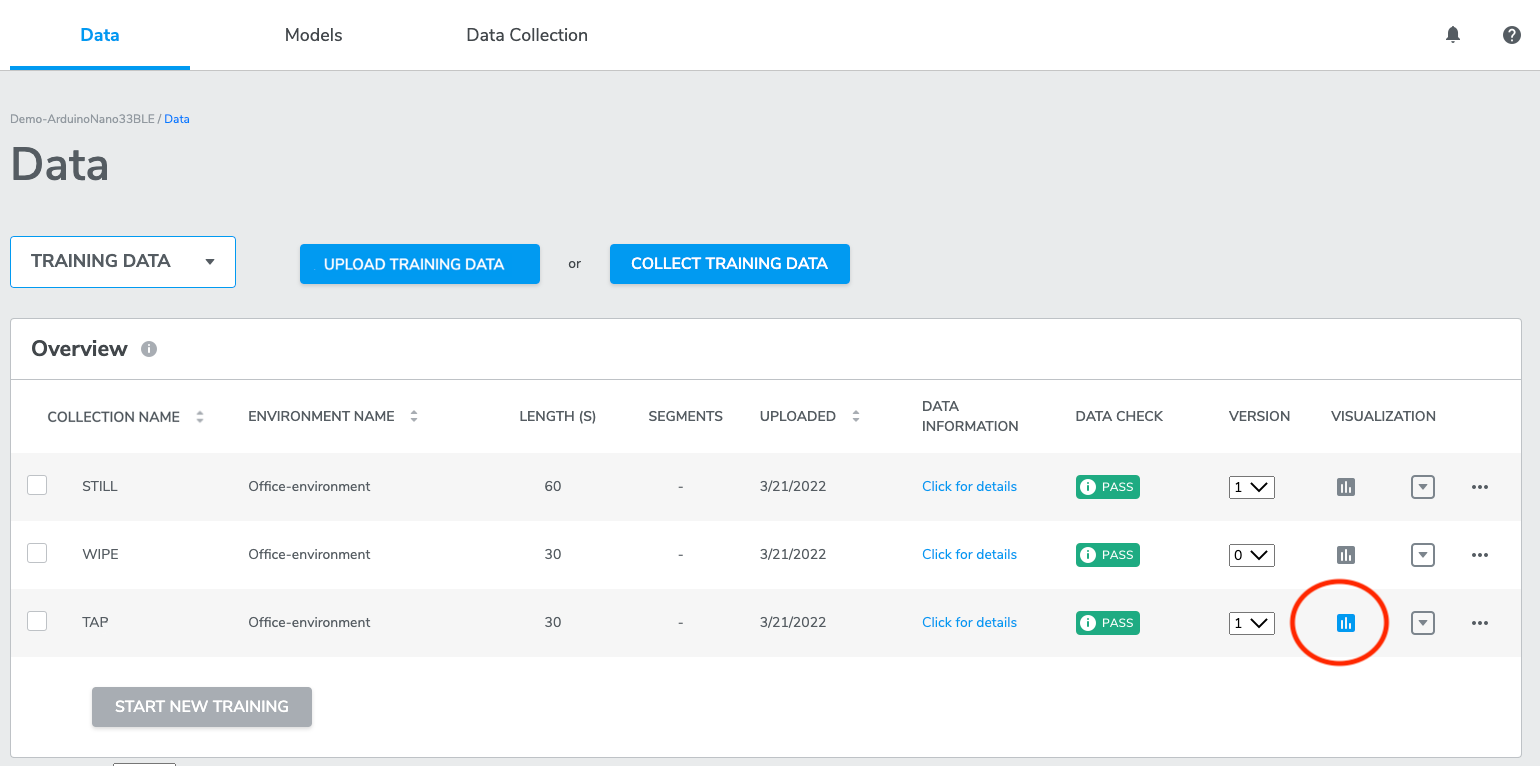
6. Visualizing data
AutoML provides users with the ability to plot and view sensor data directly from the platform using the onboard data visualization tool. To visualize training or test data, click the data visualization icon.
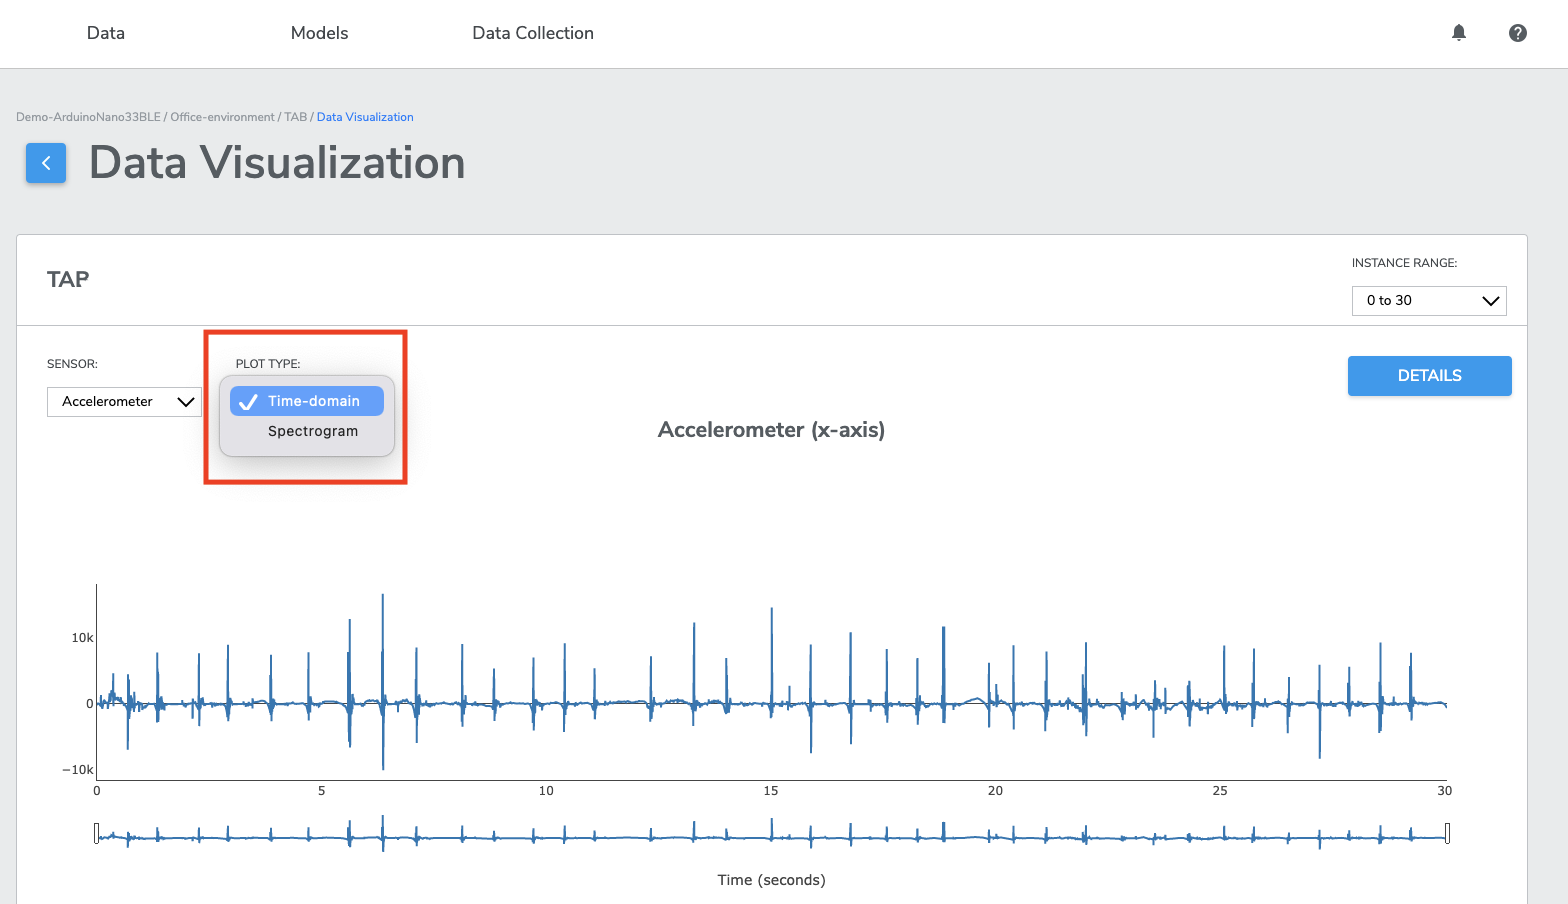
Navigate data using scroll, scale, and zoom options and view data in either Time Domain or Frequency Domain.
- Time Domainvisualization is a visual representation of the signal’s amplitude and how it changes over time. With time domain visualization, the x-axis represents time, whereas y-axis represents the signals amplitude.
- Frequency Domainvisualization, also known as spectrogram frequency visualization is a visual representation of the spectrum of frequencies of a signal as it varies with time. With spectrogram frequency visualization, the x-axis represents time, whereas y-axis represents the signal’s frequency.
7. Filter environment
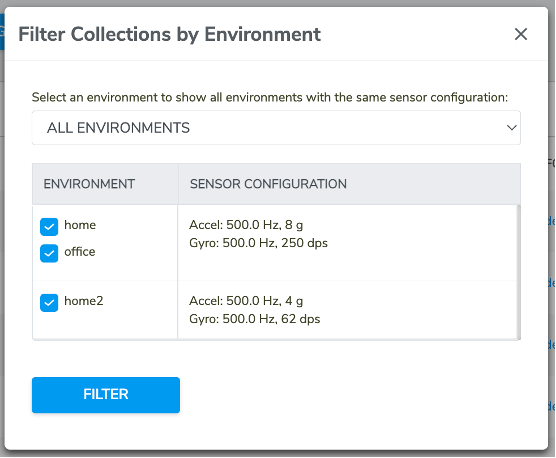
FILTER ENVIRONMENT enables you to filter your data collections with different environments settings and sensor configurations settings.

Click FILTER ENVIRONMENT button, there will be a pop-up window. On the top area of the window, there is a drop-down menu for users to select to list either all environments or any specific environment. Moving down, there is a two-columns table where users will see environment names and sensor configurations settings. Users could click or un-click the checkbox to the left to select any environment(s), then click FILTER button to apply.
Once option has been applied, users will be navigated back to DATA page, and only those data collections that match with the selection will be displayed under the DATA page.
8. SELECT ALL data collections
SELECT ALL button enables users to select all data collections listed under DATA page with a single click.
This feature is very helpful when users have many data collections to select to train a model. It saves users a lot of time and work. If users have data collections that are sharing different environments or different sensor configurations, users could use FILTER ENVIRONMENT button to filter data collections, only keep those that need to be used. Then use the SELECT ALL checkbox.
(1) although users are allowed to click to select all data collections regardless of sensor configuration settings, the START NEW TRAINING button will only become clickable when all selected data collections share the same sensor configuration;
(2) SELECT ALL checkbox only applies to current page. If there's multiple pages of data collections, users will need to conduct SELECT ALL multiple times.